
Figures & data
Table 1. Characteristics of the participants.
Figure 1. Post-vaccine salivary cortisol was significantly higher than pre-vaccine cortisol (n = 229). Comparison was calculated by independent two group t-test. Box =25th–75th percentile, whiskers =10th–90th percentile, + = mean, horizontal bar = median, *** = p < .001.
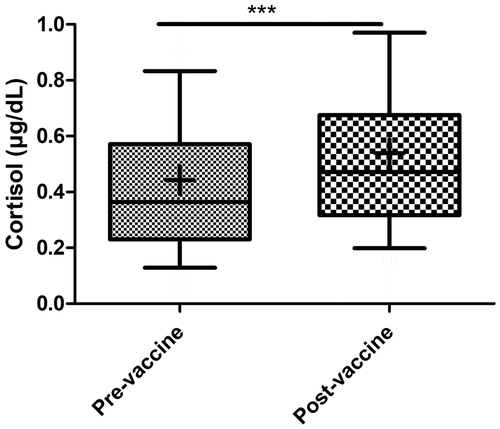
Table 2. Associations between thymic indices and 6 week vaccination-induced cortisol responsiveness (ΔCortisol) in infants determined by multivariate regression modeling.
Table 3. Associations between T cell concentrations and TREC concentrations (per million PBMC) and 6 weeks vaccination-induced cortisol responsiveness in infants determined by multivariate regression modeling.
Figure 2. Predicted probability of observing positive PPD skin test at 15 weeks by cortisol responsiveness quartiles in normally delivered exclusively breastfeed infants having median baseline cortisol, cortisol collection time, HAZ and WHZ scores. Bar represents 95% CI. Mean and CI were predicted from the regression model described in the .
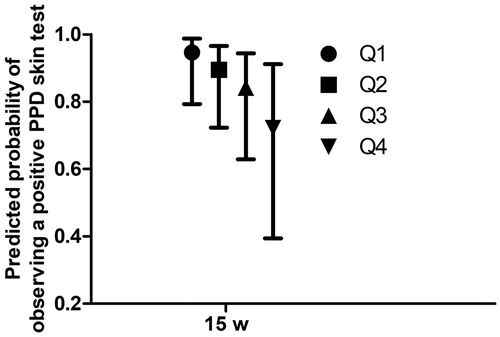
Table 4. Associations between vaccine responses and 6-week vaccination-induced cortisol responsiveness in infants.