
Figures & data
Table 1. Descriptives.
Figure 1. Principal component analysis (PCA) plots for the fasting and the postprandial condition. Grey circles are ED patients and the black circles controls.
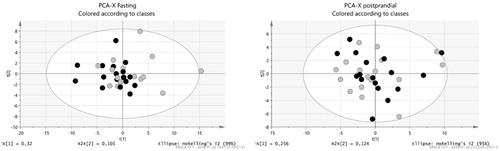
Figure 2. Loadings scatter plot visualizing the metabolite distribution in fasting. Healthy control subjects to the left (negative values) and ED patients to the right (positive values).
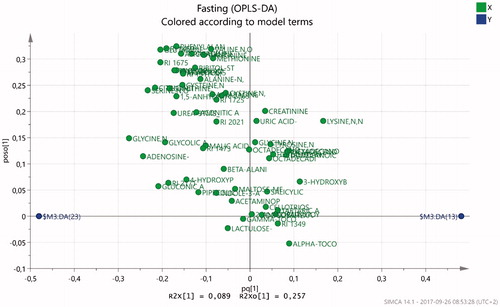
Figure 3. Metabolites identified by gas chromatography mass spectrometry (GC-MS) analysis. Metabolites of importance according to OPLS-DA analysis (Variable of Importance (VIP) > 1) are marked with arrows indicating higher (?) or lower (?) abundance in ED patients. A = fasting, B = nonfasting.
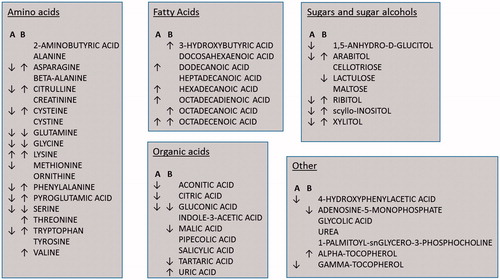
Table 2. OPLS metabolic compounds of importance for the fasting model.
Figure 4. Loadings scatter plot visualizing the metabolite distribution in nonfasting. Healthy control subjects to the left (negative values) and ED patients to the right (positive values).
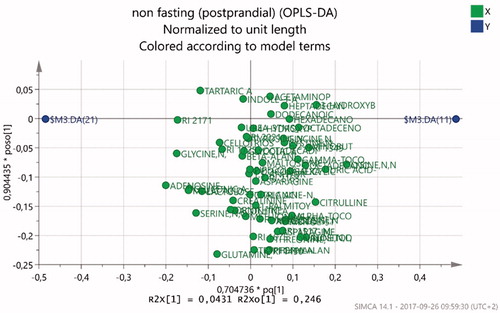
Table 3. OPLS metabolic compounds of importance for the nonfasting model.