
Figures & data
Figure 1. Cross-cultural steroid-profiling in hair; Legend: MANOVA for hairsteroids, 43 testosterone- and 29 progesterone-levels below the detection limit (<0.01 pg/mg). Cortisol 6.3 ± 0.7 SE pg/mg (J), 4.3 ± 0.5 SE pg/mg (RG), 4.0 ± 0.4 SE pg/mg (G), [F(2,123 = 5.7, p=.004; J > RG (p=.03), J > G (p=.01)]; cortisone 16.7 ± 1.8 SE pg/mg (J), 14.0 ± 1.1 SE pg/mg (RG), 13.7 ± 1.2 SE pg/mg (G), [F(2,123) = 1.4, p = 0.25]; testosterone 0.8 ± 0.1 SE pg/mg (J), 0.7 ± 0.1 SE pg/mg (RG), 0.6 ± 0.1 SE pg/mg (G), [F(2,123) = 0.80, p = 0.45]; progesterone 1.4 ± 0.3 SE pg/mg (J), 0.7 ± 0.1 SE pg/mg (RG), 2.0 ± 1.0 SE pg/mg (G) [F(2,123) = 1.2, p = 0.29]; DHEA 2.2 ± 0.6 SE pg/mg (J), 1.3 ± 0.3 SE pg/mg (RG), 0.6 ± 0.1 SE pg/mg (G), [F(2,123) = 4.5, p=.01; J > G (p=.013)]. ANOVA for “biomarker” after z-transformation (mean: cortisol/cortisone/testosterone/progesterone/DHEA):0.34 ± 0.18 SE pg/mg (J), −0.14 ± 0.13 SE pg/mg (RG), −0.22 ± 0.14 SE pg/mg (G) [F(2,122) = 4.26, p=.02].
![Figure 1. Cross-cultural steroid-profiling in hair; Legend: MANOVA for hairsteroids, 43 testosterone- and 29 progesterone-levels below the detection limit (<0.01 pg/mg). Cortisol 6.3 ± 0.7 SE pg/mg (J), 4.3 ± 0.5 SE pg/mg (RG), 4.0 ± 0.4 SE pg/mg (G), [F(2,123 = 5.7, p=.004; J > RG (p=.03), J > G (p=.01)]; cortisone 16.7 ± 1.8 SE pg/mg (J), 14.0 ± 1.1 SE pg/mg (RG), 13.7 ± 1.2 SE pg/mg (G), [F(2,123) = 1.4, p = 0.25]; testosterone 0.8 ± 0.1 SE pg/mg (J), 0.7 ± 0.1 SE pg/mg (RG), 0.6 ± 0.1 SE pg/mg (G), [F(2,123) = 0.80, p = 0.45]; progesterone 1.4 ± 0.3 SE pg/mg (J), 0.7 ± 0.1 SE pg/mg (RG), 2.0 ± 1.0 SE pg/mg (G) [F(2,123) = 1.2, p = 0.29]; DHEA 2.2 ± 0.6 SE pg/mg (J), 1.3 ± 0.3 SE pg/mg (RG), 0.6 ± 0.1 SE pg/mg (G), [F(2,123) = 4.5, p=.01; J > G (p=.013)]. ANOVA for “biomarker” after z-transformation (mean: cortisol/cortisone/testosterone/progesterone/DHEA):0.34 ± 0.18 SE pg/mg (J), −0.14 ± 0.13 SE pg/mg (RG), −0.22 ± 0.14 SE pg/mg (G) [F(2,122) = 4.26, p=.02].](/cms/asset/a815efd2-6aa8-4a29-a1c1-9803d23919d2/ists_a_1494151_f0001_c.jpg)
Figure 2. (a) Associations between parental overprotecting and LHPA axis activity/line of regression for aggregated variables “Biomarker” associated to “Parental Overprotecting” in Jewish subjects. (b) Associations between parental overprotecting and LHPA axis activity/line of regression for aggregated variables “Biomarker” associated to “Parental Overprotecting” in Russian German subjects. (c) Associations between parental overprotecting and LHPA axis activity/line of regression for aggregated variables “Biomarker” associated to “Parental Overprotecting” in native German subjects.
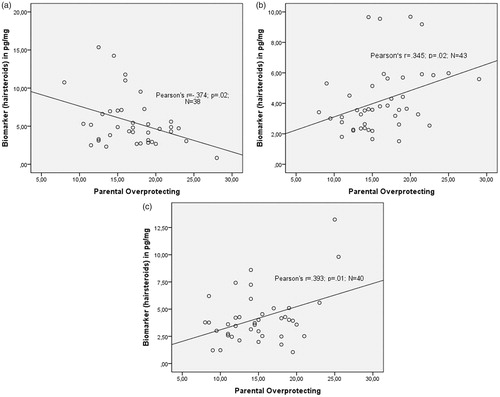
Table 1. sociodemografic as well as stress- and hair-related variabilities of German natives, Jewish- and Russian-German-immigrants.
Table 2. Hierarchical regression analysis predicting cortisol concentration from group (Jewish and non-Jewish), parental overprotecting and their interaction, controlling for age and gender.
Table 3. Anti-semitism and overprotection by Jewish parents.