Figures & data
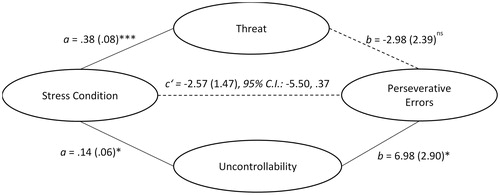
Figure 1. Performance on the BCST, including the frequency of (A) perseverative and non-perseverative errors, (B) trials to first category, and (C) failures in maintaining a set, between individuals who experienced the TSST and control conditions. Error bars represent ± S.E. *p <.05. Note: Figures 1B and 1C display Log10 transformed scores.
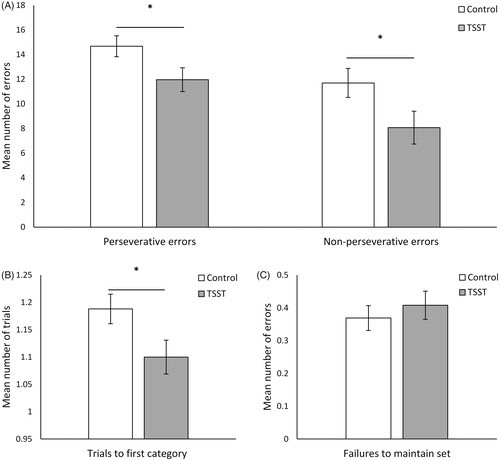
Figure 2. Salivary cortisol levels (±S.E.) before and after the TSST and control conditions. **p <.01, ***p <.001.
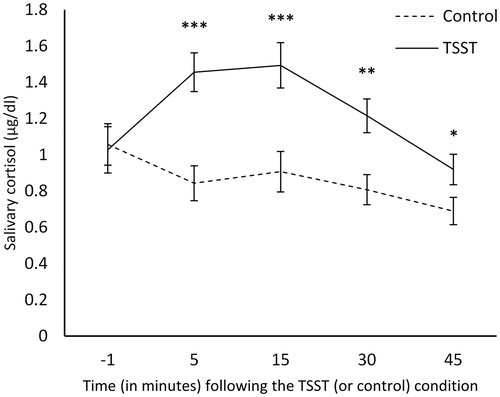
Figure 3. The mediating role of cortisol in acute stressor effects on set-shifting. **p <.01, ***p <.001.
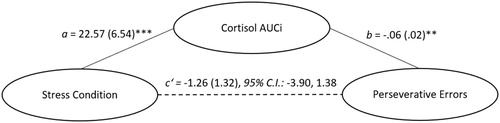
Figure 4. The mediating role of perceived uncontrollability in the effects of the acute stressor on set-shifting, *p <.05, ***p <.001. ns: not significant.