Figures & data
Figure 1. A: Schematic representation of pGl3 constructs containing 3651 bp of the human CRH promoter sequence. The single nucleotide polymorphisms (SNPs) rs503875 (T/G) and rs3176921 (T/C) in the CRH promoter are highlighted in boxes. Combination of both SNPs results in three haplotypes. The arrow represents the transcription start site. B: Location of studied CRH SNPs in the promoter region and diagrammatic representation of the CRH promoter showing the sequential occurrence of response elements that are thought to have a functional role regulating gene expression. (The location in the figure is not in relative correspondence to the actual sequence size).
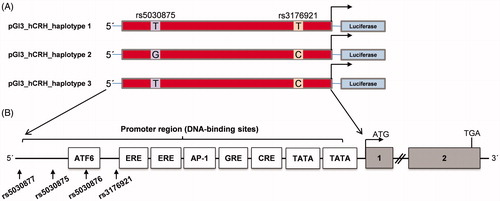
Table 1. Pairwise comparison of promoter activity between three CRH promoter haplotypes in two cell lines under basal and stimulation condition.
Table 2. The association of haplotypes of the CRH promoter with the cortisol level, blood pressure and heart rate under basal and stress condition.
Figure 2. Activity of different CRH promoter alleles (haplotypes 1, 2, and 3) measured by luciferase activity in the AtT-20 cell line (A–D) and the U373MG cell line (E–H). Cells were treated with forskolin (50 µM) and hydrocortisone (2.7 µM) for 24 h before subjected to dual luciferase reporter assay. (A) AtT-20 cells in control condition. (B) AtT-20 cells under forskolin stimulation. (C) AtT-20 cells under hydrocortisone stimulation. (E) U373MG cells in the control condition. (F) U373MG cells under forskolin stimulation. (G) U373MG cells under hydrocortisone stimulation. Fold induction of luciferase activity of three haplotypes with respect to the control condition in AtT-20 (D) and U373MG cells (H). The results are represented as the mean ± SEM of three independent experiments performed in triplicate. (*p < .05; **p < .01; ***p < .001).
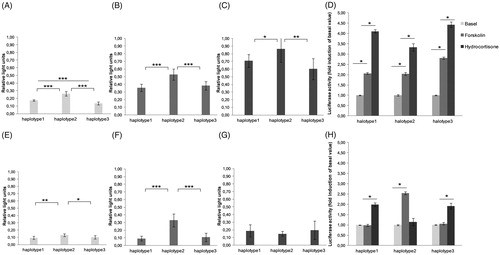
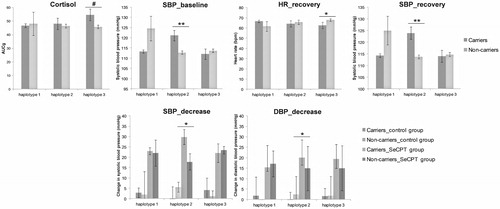
Figure 3. Mean values corresponding to ANOVA results: Asterisks indicate a significant main effect of haplotype (carriers, non-carriers) in the upper section or a significant interaction of a haplotype (carriers, non-carriers) and the socially evaluated cold pressure (SeCPT) manipulation in the lower section. Baseline data were considered as average value of three measurements before water task. Recovery was calculated using the three measurements after the water task. Decrease referred to the dependent variables from the peak to the recovery period. The results are represented as the mean ± SEM. (*p < .05; **p < .001, #p = .05).