Figures & data
Figure 1. INS-1 cell viability in different groups. ** p < .01, ## p < .01 vs. LPS group.
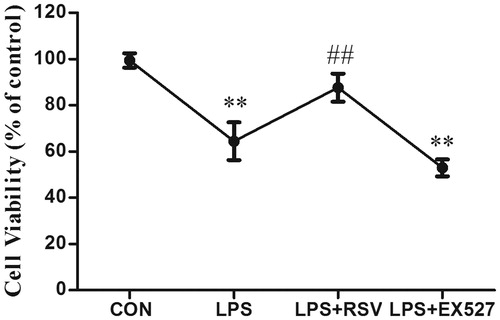
Figure 2. (A) Effects of RSV or EX527 pretreatment alone on SIRT1 protein expression. (B) Effects of changeable SIRT1 activity on the expression of TLR4 protein. Pretreated INS-1 cells with RSV or EX527 to detect the expression of TLR4 and investigate the relationship between TLR4 and SIRT1. More than three individual experiments were implemented. * p < .05, ** p < .01, vs. control. # p < .05 vs. LPS group.
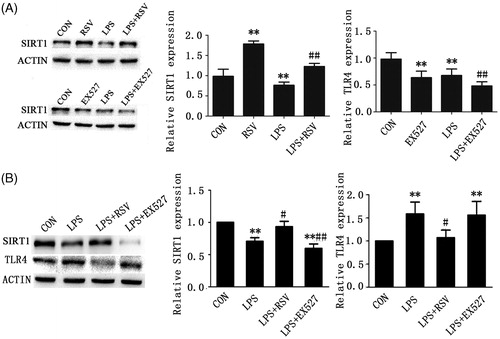
Figure 3. Activation of SIRT1 could reverse LPS-induced ROS generation. A. ROS production was observed under fluorescence microscope (×200). Intensity of the fluorescence where white arrows point representing ROS production. (a) CON group, (b) LPS group (treated with 1 mg/L LPS), (c) LPS + RSV (pretreated with 10 μmol/L RSV, then treated with 1 mg/L LPS), (d) LPS + EX527 group (pretreated with 20 μmol/L EX527, then treated with 1 mg/L LPS). B. ROS production was detected by flow cytometry. Values are means ± SD of more than three individual experiments. ** p < .01 vs. control. ## p < .01 vs. LPS group.
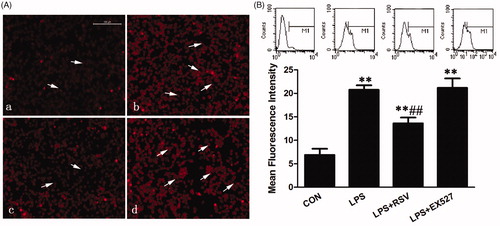
Figure 4. SIRT1 inhibited superoxide production in LPS-stimulated INS-1 cells. Fluorescence intensity by MitoSOX Red where white arrows point represents the amount of superoxide production, DAPI stained region which white arrows point represents damaged nucleus. A. Effects of SIRT1 activity on superoxide production in INS-1 cells by fluorescence microscopy (×400). B. Fluorescence intensity analysis in INS-1 cells by flow cytometry. Vertical coordinate represents the red MFI of superoxide. * p < .05 vs. control. # p < .05 vs. LPS group.
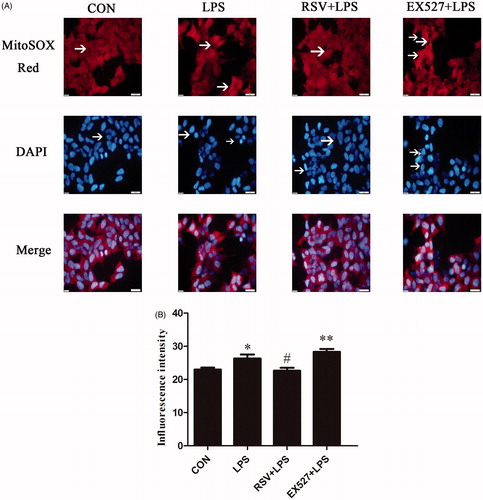
Figure 5. Detection of SOD activity and MDA content in INS-1 cells by activating or inhibiting SIRT1. Values are means ± SD of more than three individual experiments. * p < .05, ** p < .01 vs. control group. # p < .01 vs. LPS group.
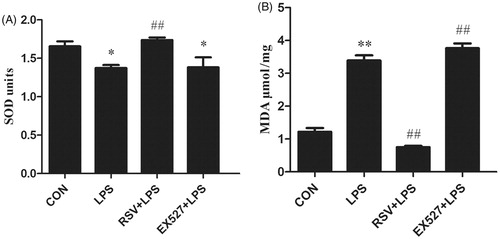
Figure 6. Activation of SIRT1 inhibited LPS induced INS-1 cells insulin secretion. Incubated INS-1 cells with 1 mg/L LPS for 24 h induced a significant decrease in GSIS. Pretreated INS-1 cells with 10 μmol/L RSV reversed insulin secretion reduction induced by LPS. White column represents BIS induced by 3.3 mmol/L glucose. Black column represents GSIS induced by 16.7 mmol/L glucose. Values are means ± SD of more than three individual experiments. * p < .05, ** p < .01 vs. control, # p < .05 vs. LPS group.
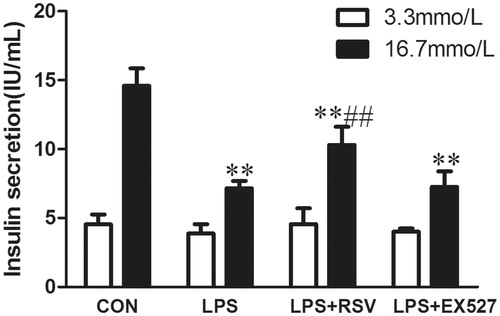
Figure 7. Acetylation of FoxO1 and nucleus-cytoplasm distribution of SIRT1/FoxO1. A. Protein expression of acetylated FoxO1 in INS-1 cells by LPS stimulation with or without RSV for 24 h. B. Cytoplasmic protein expression of SIRT1 and FoxO1. C. Nuclear protein expression of SIRT1 and FoxO1. Values are means ± SD of more than three individual experiments. * p < .05, ** p < .01 vs. control. ## p < .01, # p < .05 vs. LPS group.
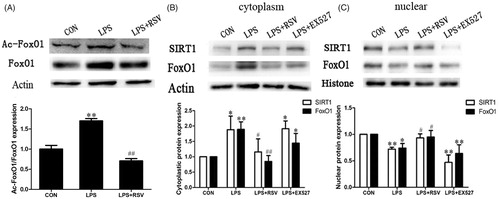
Figure 8. Activation of SIRT1 alleviated LPS-induced decreased mitochondrial membrane potential in INS-1 cells. A. Fluorescence intensity pictures were collected from laser confocal microscopy, 6 pictures gotten from in each group. B. Fluorescence intensity was measured by ZEN 2009 Light Edition software. C. Effects of different treatments on mitochondrial membrane potential in INS-1 cells by flow cytometry. Abscissa represents the form of JC-1 monomer while ordinate represents the form of JC-1 polymer, value of quadrant Q2 represents the red/green fluorescence ratio at the early stage of cellular apoptosis. D. Right histogram was based on the statistical results from flow cytometry. Values are means ± SD of more than three individual experiments. ** p < .01 vs. control. # p < .05, ## p < .01 vs. LPS group.
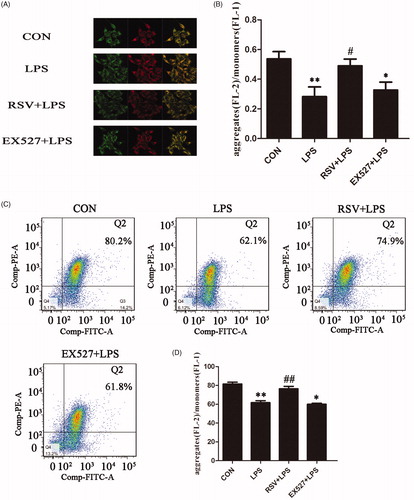
Figure 9. Effects of SIRT1 on LPS-induced apoptosis in INS-1 Cells. Incubated INS-1 cells with 1 mg/L LPS for 24 h induced a significant increase in apoptosis. Pretreated INS-1 cells with 10 µmol/L RSV alleviated LPS-induced apoptosis. A. Effects of SIRT1 activation on LPS-induced apoptosis in INS-1 cells by flow cytometry. B. The histogram was based on the statistical results from flow cytometry. C–E. Detection of apoptotic protein expression by western blot. More than three individual experiments were implemented in each group. ** p < .01 vs. control. # p < .05, ## p < .01 vs. LPS group.
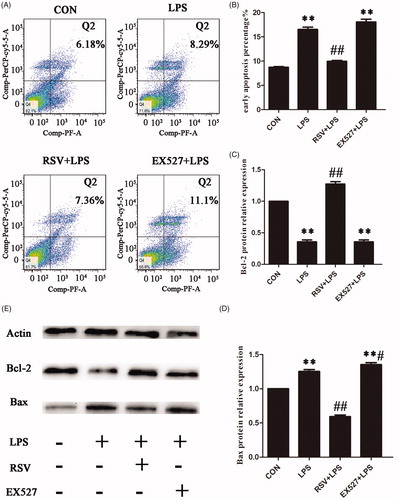
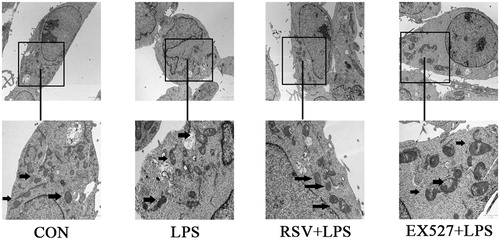
Figure 10. Effects of different treatments on mitochondrial structure in INS-1 cells by transmission electron microscope (×2 μm), the second row pictures were adapted from upper pictures (×1 μm). Arrows refer to mitochondria in different groups. Mitochondria became irregular, swelling and showed more disordered ridges induced by LPS. RSV pretreatment alleviated these damages, but EX527 pretreatment further damaged mitochondrial structure, showing more obscuring or even fragmentary outer membrane.