
Figures & data
Figure 1 : Diagram showing the four hair segments used in analyses. Dashed boxes indicate segments on each hair sample used in analyses: (A) 3–6 cm from the scalp on hair sample 1 reflecting the preconception period, (B) 3 cm from the scalp on hair sample 1 reflecting the 1st trimester, (C) 3–6 cm from the scalp on hair sample 2 reflecting the 2nd trimester, and (D) 3 cm from the scalp on hair sample 2 reflecting the 3rd trimester.
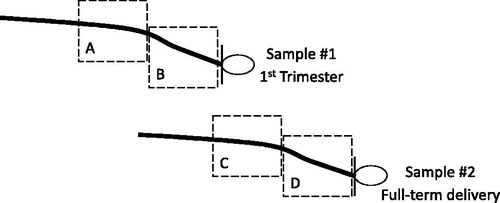
Figure 2 : Mean log-transformed hair cortisol concentrations at the four hair segments (preconception, 1st trimester, 2nd trimester, 3rd trimester), by hair sample (1 or 2) (N = 97 participants). Gray boxes indicate 95% error bars. The difference in mean logHCC comparing preconception to the first trimester was 1.28 (standard deviation (SD) = 1.00) vs. 1.64 (SD = 0.96), p-value <.0001. The difference in mean logHCC comparing the first and second trimesters was 1.64 (SD = 0.96) vs. 1.75 (SD = 0.89), p-value >.05. The difference in mean logHCC comparing the second and third trimesters was 1.75 (SD = 0.89) vs. 2.22 (SD = 0.88), p-value <.0001.
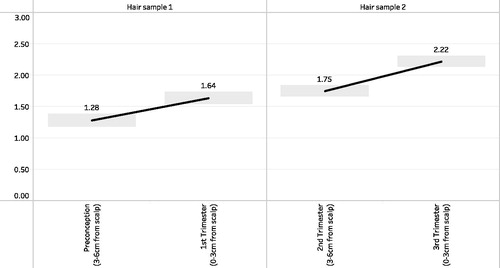
Table 1: Distribution of participant characteristics at enrollment (N = 97 participants).
Table 2: Pearson correlation coefficients (r), and mean differences (∂) and standard deviations (SD) of log-transformed hair cortisol concentrations from preconception to the 3rd trimester (N = 97 participants).
Table 3. Mean log-transformed hair cortisol concentrations at the four hair segments (preconception, 1st trimester, 2nd trimester, 3rd trimester) by each stress measure (N = 97 participants).
Figure 3. Mean log-transformed hair cortisol concentrations for the four hair segments (preconception, 1st trimester, 2nd trimester, 3rd trimester), by hair sample (1 or 2) and measure of stress assessed (gray = no, black = yes). CA = child abuse; IPV = intimate partner violence; PSS = perceived stress score; PTSD = Post-traumatic Stress Disorder. *An asterisk indicates that the difference in mean logHCC values comparing the two groups at that segment was statistically significant at the alpha 0.05 level. For depression at enrollment (N = 96).
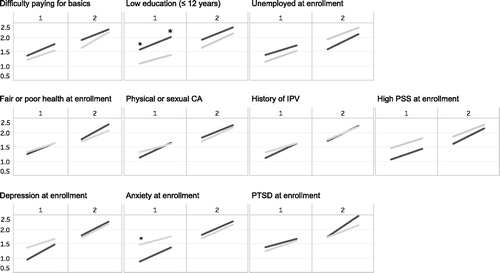
Table 4: Linear model results for the effect of stress (group), time (preconception, 1st trimester, 2nd trimester, 3rd trimester), and group by time on mean logHCC patterns from preconception to the 3rd trimester.
Table 5. Pearson correlation coefficients (r) of log-transformed hair cortisol concentrations (logHCC) from preconception to the 3rd trimester with continuous scores of psychological distress at enrollment (N = 97 participants).