Figures & data
Figure 1. Schematic diagram of experimental design. After classification of rats into three groups (each n = 7) and two weeks habituation (PND 21–35), physical and psychological stress induction was done on five consecutive days (postnatal day, PND, 35–39). After verification of stress induction by serum corticosterone measurement on PND39, the rats were housed for 6 weeks. In adulthood, behavioral performance, serum PAB, and heart rate were evaluated (PND 80–90). H: habituation; SI: stress induction (physical or psychological); C: corticosterone measurement; EPM: elevated plus maze; FST: forced swimming test; YM: Y-maze; PAT: passive avoidance test; ORT: object recognition test; R: rest; PAB: pro-oxidant-antioxidant balance assessment; HR: heart rate measurement.
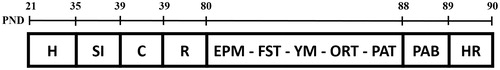
Figure 2. Anxiety-related and depressive-like behaviors assessment using EPM (A–C) and FST (D,E), respectively. (A) The percentage time rats spent in an open arm: **p < .01 psychological stress vs. control and physical stress. (B) The number of open arm entries: *p < .05 psychological stress vs. control. (C) The total number of entries into the open and closed arm: **p < .01 psychological stress vs. control and ***p < .001 psychological stress vs. physical stress (N = 7 per group). (D) Duration of struggling, swimming, and immobility: *p < .05 immobility of psychological stress vs. physical stress, **p < .01 within-group differences in psychological stress for immobility vs. struggling and ***p < .001 within-group differences in psychological stress for immobility vs. swimming. (E) Number of diving events: *p < .05 psychological stress vs. control. Data are expressed as mean ± SEM. Data were analyzed by two-factor mixed ANOVA followed by Tukey’s post-hoc test (N = 6 per group). EPM: elevated plus maze; FST: forced swimming test.
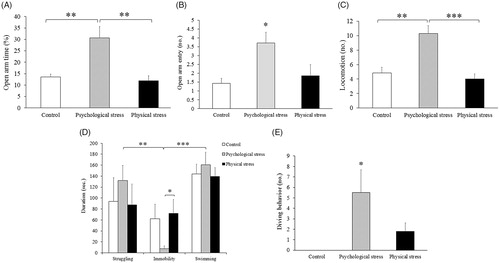
Figure 3. Spatial memory, object-recognition memory and fear memory performance evaluation using Y-maze (A,B), ORT (C) and PAT (D), respectively. (A) Duration of novel arm visits: *p < .05 novel arm time for psychological stress vs. control and physical stress. (B) The number of novel arm visits: no statistically significant differences between groups were found (N = 6 per group). (C) Discrimination index: ***p < .001 psychological stress vs. control. *p < .05 psychological stress vs. physical stress (N = 6 per group). (D) PAT: ***p < .001 latency times for acquisition days, physical stress vs. control. *p < .05 latency times for retention days, physical stress vs. control. &p<.05 within-group differences in control group for latency times of retention day vs. acquisition day, and &&&p < .001 within-group differences in psychological stress group for latency times of retention day vs. acquisition day. Data are expressed as mean ± SEM. Data were analyzed by two-factor mixed ANOVA followed by Tukey’s post-hoc test (N = 6 per group). YM: Y-maze; ORT: object recognition test; PAT: passive avoidance test.
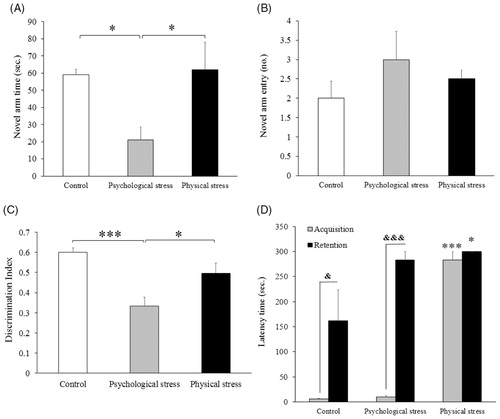
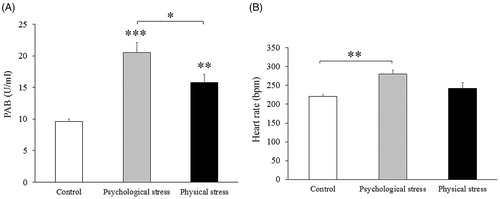
Figure 4. Physiological effects of repeated adolescent physical and psychological stresses. (A) Serum PAB: ***p < .001, psychological stress vs. control. **p < .01 physical stress vs. control. *p < .05 psychological stress vs. physical stress (N = 6 per group). (B) Mean heart rate: **p<.01 psychological stress vs. control. Data are expressed as mean ± SEM. Data were analyzed by one-way ANOVA followed by Tukey’s post-hoc test (N = 6 per group). PAB: pro-oxidant-antioxidant balance.