
Figures & data
Table 1. Subject characteristics and dex/CRH test indicators.
Figure 1. Regions-of-interest for the quantification of noradrenaline transporter availability. The outlined regions-of-interest are exemplarily shown on an individual MR (top row). The same regions are depicted with arrows on an averaged parametric PET (NAT DVR) image (bottom row).
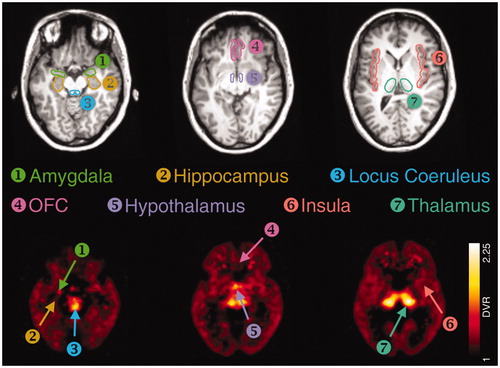
Figure 2. HPA responsiveness in the course of time. Obesity group vs. non-obesity controls. Time course of ACTH (A) and cortisol response (B) to the combined dex/CRH test in subjects with obesity (N = 10; solid line, squares) and non-obesity controls (N = 10; dashed line, circles). After 1.5 mg dexamethasone, taken orally at 2300 h, the night before the test, a bolus of 100 ug CRH was applied i.v. at 1502 h. Data are given as mean with standard error. Dex: dexamethasone; CRH: corticotropin-releasing hormone; ACTH: adrenocorticotropic hormone.
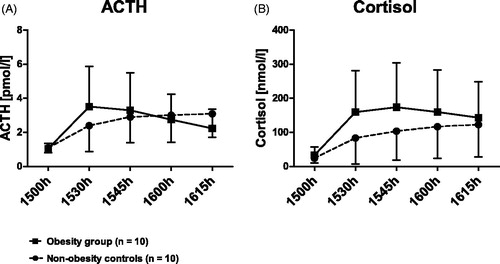
Figure 3. Non-obesity controls. NAT DVR in relation to HPA axis responsiveness and serum copeptin. Noradrenaline transporter distribution volume ratios and neuroendocrine parameters in non-obesity controls. Spearman-rho and p-value given for significant correlations. Data are presented in ranks with regression line and 95% confidence interval. MAX: maximum; ACTH: adrenocorticotropic hormone. Significant positive correlations were found between noradrenaline transporter (NAT) distribution volume ratios (DVR) of the orbitofrontal cortex (OFC) and the amygdala with ACTH and cortisol maxima (D, E, G, H). No correlation of copeptin with NAT DVR was found (C, F, I).
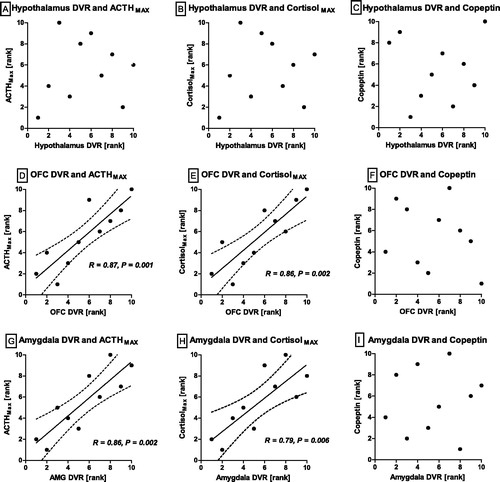
Figure 4. Obesity group. NAT DVR in relation to HPA responsiveness and serum copeptin. Noradrenaline transporter distribution volume ratios and neuroendocrine parameters in the obesity group. Spearman-rho and p-value given for significant correlations. Data are presented as ranks with regression line and 95% confidence interval. MAX: maximum; ACTH: adrenocorticotropic hormone. Significant negative correlations were found between noradrenaline transporter (NAT) distribution volume rations (DVR) of the hypothalamus with cortisol maximum (B) and copeptin, measured after dexamethasone ingestion, prior to CRH administration (C). No correlations between the neuroendocrine parameters with NAT DVR of the orbitofrontal cortex (OFC) or amygdala DVR were found (D–I).
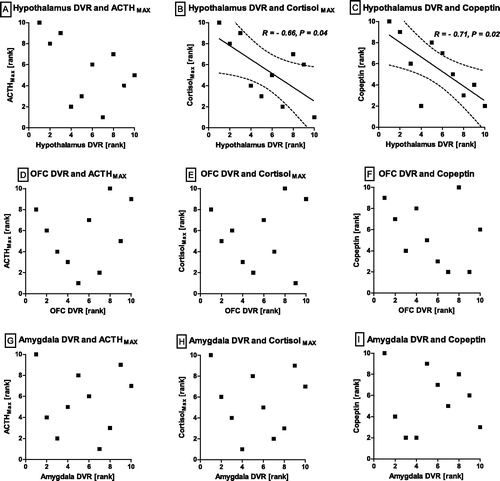
Table 2. Spearman correlation of dex/CRH test indicators and noradrenaline transporter availability.