
Figures & data
Table 1. Characteristics of individuals (N = 32).
Figure 1. Wingate timesheet. The timeline information is related to the use of stress. Solid line = subject on ergometer; dashed line: subject in supine or seated position; arrow down: permanent venous catheter; marked columns: physical stress.
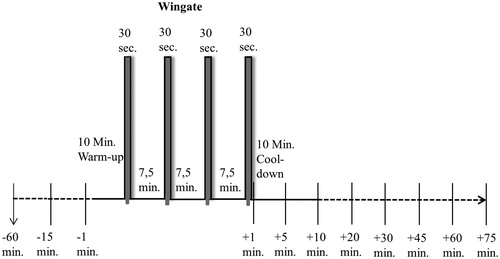
Figure 2. Trier Social Stress Test timesheet. Timeline information is related to the use of stress. Solid line: subject in stress task; dashed line: subject in supine or seated position; arrow down: permanent venous catheter; marked column: psychosocial stress.
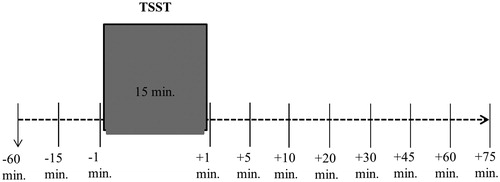
Figure 3. Serum cortisol response (nmol/l) to physical (Wingate) and psychosocial stress (TSST) in 32 healthy subjects. Shown are the mean values with standard errors. Time information is related to the use of stress. Marked column: stress induction; white circles: Wingate; black squares: TSST.
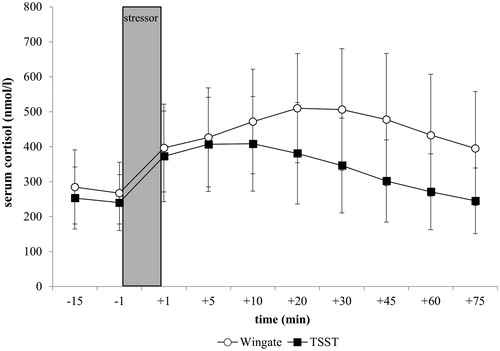
Figure 4. HRV response to physical (Wingate) and psychosocial stress (TSST) in 32 healthy subjects. (a) Root mean square successive differences (RMSSD), (b) Low frequency power (LF) and (c) Low frequency/high frequency ratio (LF/HF). Shown are the mean values with standard errors. sb : standardized breathing, rec : recovery. White circles: Wingate; black squares: TSST.
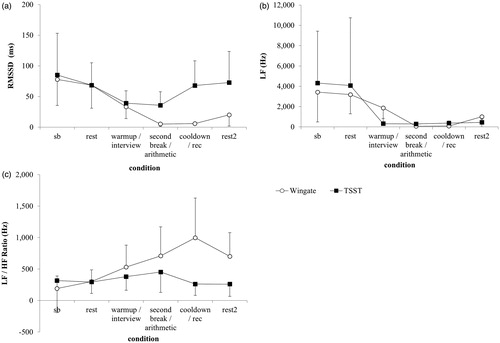
Table 2. HRV statistics.