
Figures & data
Figure 1. Distribution of KITLG methylation levels at each of the seven CpG units (a) raw methylation data; (b) log transformed methylation data which gives a better indication of the distribution of the data.
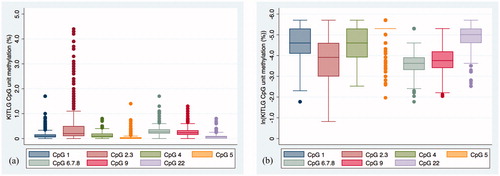
Table 1. Participant characteristics (n = 142).
Figure 2. Scatterplot indicating the association between KITLG DNA methylation at unit CpG 2.3 and stress reactivity cortisol levels (a) morning cortisol; (b) diurnal cortisol levels (AUC).
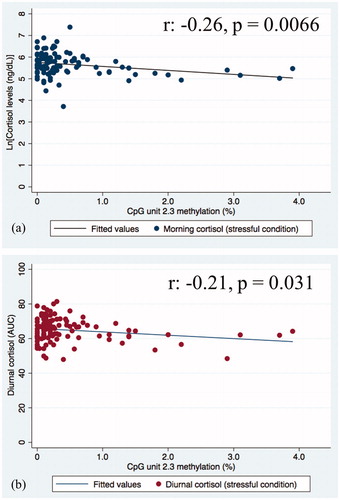
Table 2. Linear regression models for the association between KITLG DNA methylation (%) and cortisol levels under stress.
Table 3. The association between childhood stressful events and KITLG DNA methylation.
Supplemental Material
Download MS Word (211.3 KB)Data availability
The datasets analyzed during this study are available from the corresponding author on reasonable request.