Figures & data
Figure 1. Specificity of real-time PCR amplification. Melting curves (dissociation curves) of the 9 reference gene amplicons after the real-time PCR reactions, all showing one peak. X-axis (horizontal): temperature (°C); Y-axis (vertical): negative derivative of fluorescence over temperature (-dF/dT).
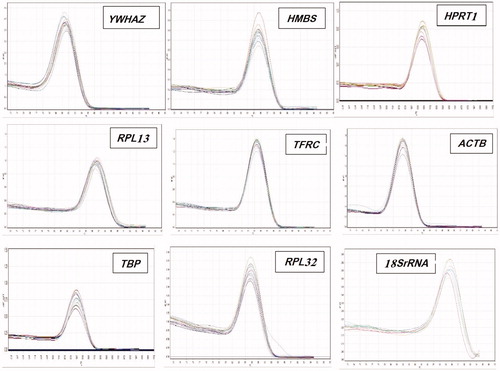
Table 1. Name and function of genes mentioned in the text.
Table 2. Primers used for quantitative real-time PCR analysis of chicken mRNAs.
Table 3. Candidate reference genes ranking in the uterus of heat-stress and control hens.
Table 4. Candidate reference genes ranking in the ovary of heat-stress and control hens.
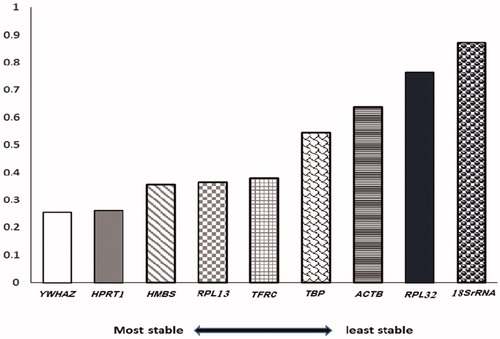
Figure 2. The overall result (mean) of the most stable reference genes in both ovary and uterus of heat-stress and control hens.