Figures & data
Figure 1. Reconstruction of the recorded locations on coronal brain sections. Three representative sections from the A1 and mPFC are at 4 mm posterior and 3.5 mm anterior to the bregma, respectively.
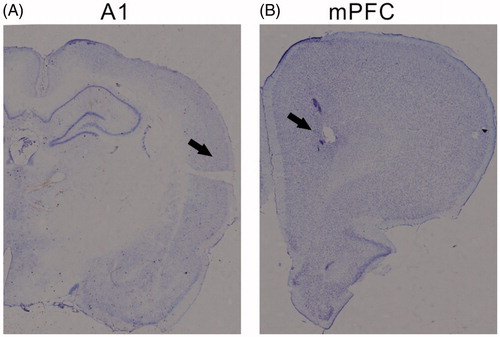
Figure 2. Bar plots showing the mean and SE of heart rate and vocalization during the normal and arousal sessions. **p < .01, paired t-test.
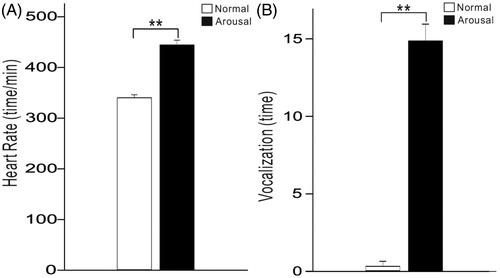
Figure 3. Example of averaged LFPs evoked by 40-Hz click-trains in A1 and mPFC under normal and arousal conditions. (A) and (B) unfiltered LFP in A1 and mPFC under normal condition. Vertical lines at the top of the plot represent the stimulus of click-train. (C) and (D) filtered LFP to show the ASSR of 40-Hz. (E) and (F) unfiltered LFP under arousal condition. (G) and (H) filtered ASSR under arousal condition.
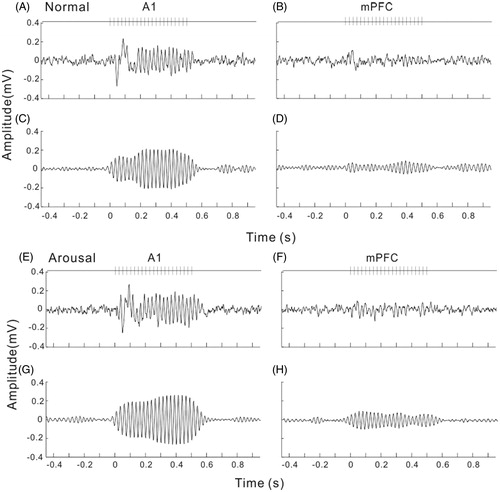
Figure 4. Individual ASSRs of each trial in one session. The same example shown in . (A) and (B) ASSR of A1 under normal and arousal condition. Black lines are the individual ASSRs, white line is the averaged ASSR. (C) and (D) ASSR of mPFC under normal and arousal condition.
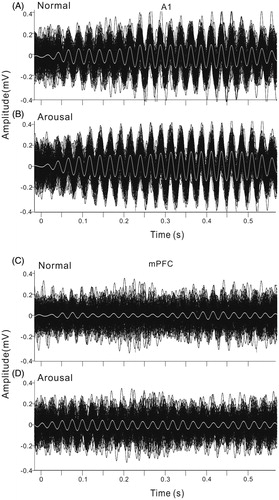
Figure 5. Spectral-temporal function of MTP and PLF in A1. (A) and (B) MTP of A1 under normal and arousal condition. (C) and (D) PLF of A1 under normal and arousal condition.
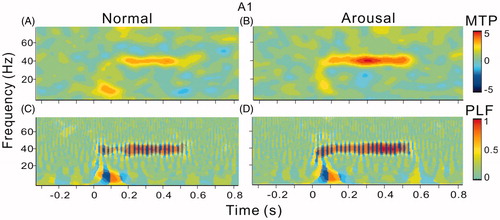
Figure 6. Spectral-temporal function of MTP and PLF in mPFC. The same format as .
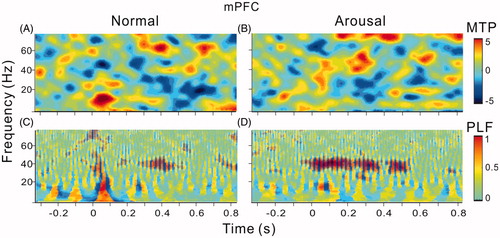
Figure 7. Bar graph showing the mean and SE of MTP and PLF in different brain areas and under different conditions. Note significant enhancement of MTP and PLF in A1, and significant enhancement of PLF in mPFC. **Indicates p < .01, paired t-test.
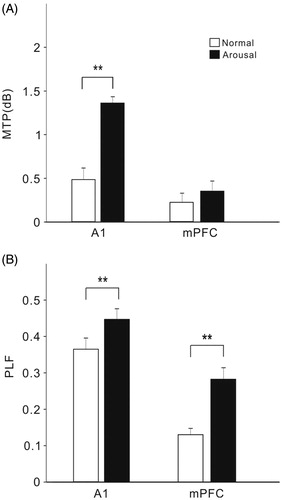
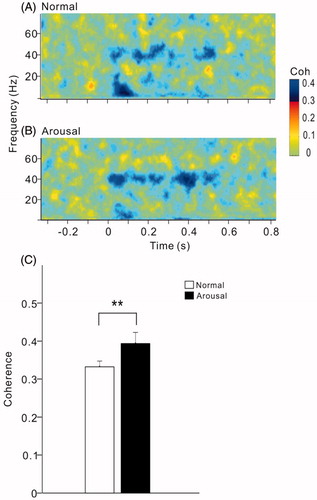
Figure 8. Spectral-temporal function of coherence between A1 and mPFC under normal (A) and arousal condition (B). The same example shown in . Note an enhancement of coherence at 40-Hz under arousal condition. (C) Bar graph showing the mean and SE of 40-Hz coherence in all the rats under different conditions. **Indicates p < .01, paired t-test.