Figures & data
Table 1. Demographic characteristics of participants.
Figure 1. Lowest average observed heart rate (HR) during a work shift in subjects. PA = physically active; Not PA = not physically active. Bars are means ± standard deviations of the means. N = 23.
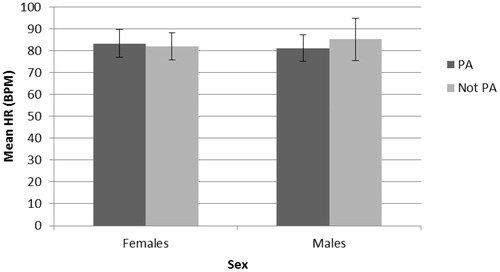
Table 2. Observed HR (BPM) throughout work shift.
Figure 2. Highest average observed heart rate (HR) during a work shift in subjects. Unpaired t-test revealed that resting HR values (mean = 83.2 BPM ± 7.8) significantly increased (p < .0001) throughout the shift (highest HR mean = 109.1 BPM ± 11.7) in all subjects. Both female (n = 7, p < .0001) and male (n = 16, p < .0001) subjects demonstrated a significant increase in HR. Two-way ANOVA indicated that female subjects demonstrated a significantly elevated highest HR compared with males (p = .03). Physical activity status did not influence the highest HR observed (p = .8). PA = physically active; Not PA = not physically active. Bars are means ± standard deviations of the means.
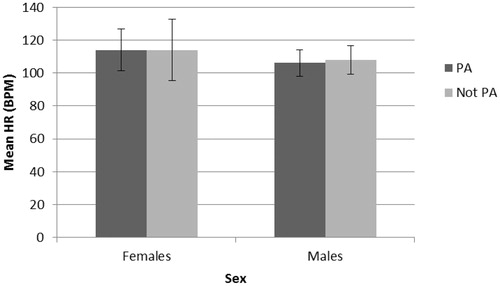
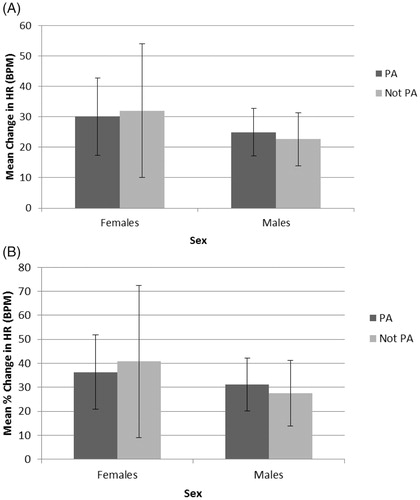
Figure 3. Average change (A) and percent change (B) in heart rate (HR) during a work shift in subjects. Two-way ANOVA revealed that females had a larger change in HR throughout a work shift compared with males (, p = .05), however, physical activity status did not modulate this change (p = .94). Females had a larger percent change in HR throughout a work shift compared with males (, p = .03) while physical activity had no effect (p = .96). PA = physically active; Not PA = not physically active. Bars are means ± standard deviations of the means.