Figures & data
Figure 1. Outline of the experimental protocol. Rats from the eighth generation (F8) of CAST rats were weaned at postnatal day 21 (P21) and submitted to the CAST protocol between P28 and P30. At 5 months of age (5 mo.), young-adults were paired with females for one week in order to mate and generate the F9 generation of CAST rats. During the mid-age period, between 11 and 15 months of age (11–15 mo.), rats were tested on different behavioral tests (see Supplementary Material for details): an open field (OF), a social preference test (SP), and an elevated plus maze (EPM). Reaction to stress at early aging was assessed with three stress challenges applied at 16 months of age (16 mo.): rats were stressed with three different stressors over three consecutive days (P473–475) and blood was sampled following stress exposures. At 16 and 17 months of age (16–17 mo.), rats were trained in a Morris water maze task. At 18 months of age (18 mo.), rats were tested in a forced-swim test (FST) and blood was sampled. Finally, rats were sacrificed and adrenal glands weighted at 19 months of age (19 mo.). The lightning cartoon indicates a stress procedure. The blood drop cartoon indicates blood sampling for determination of corticosterone in response to stress.
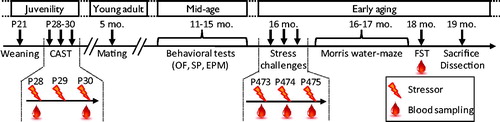
Figure 2. Different behavioral responses to stress between male rats from the CAST lines. (A) At postnatal days 28 and 30 (P28 and P30), corticosterone (CORT) responses differed during CAST. At P28, Low line rats had a lower CORT response compared to Inter and High Lines. At P30, Low line rats had a lower CORT response in comparison to both Inter and High lines and High line animals had higher CORT compared to Inter line rats. (B) The adaptation to stress, evaluated from the CORT response changes between P28 and P30, differed between the lines. Low line rats had a higher habituation (more positive adaptation) than Inter line rats and High line rats had a negative adaptation. Asterisks above columns indicate t-test statistics against 0% adaptation (i.e. no changes in CORT responses between P28 and P30). (C) At 16 months of age (16 mo.), CORT responses after the exposure to three stressors showed the same line-dependent divergent profile as in younger rats. When CORT levels, following the three stressors, were analyzed independently, we observed that the Low line had lower CORT than the Inter line following exposure to restraint (p = .005) and EP (p = .005) but not after the bucket stress (p = .58). Moreover, Low line rats had lower CORT levels compared to the High line following the three stressors (p = .005, p < .001, and p < .001, respectively). There was a statistical difference in CORT response between Inter and High lines following the bucket stress (p = .025) and EP (p = .006) but not after restraint stress (p = .278). (D) At 18 months of age (18 mo.), High line rats had higher CORT response to a forced-swim test (FST) than both Low and Inter lines. Low (n = 9–10), Inter (n = 9–10), and High (n = 8–9). Asterisks represent statistical differences: *p < .05, **p < .01, ***p < .001.
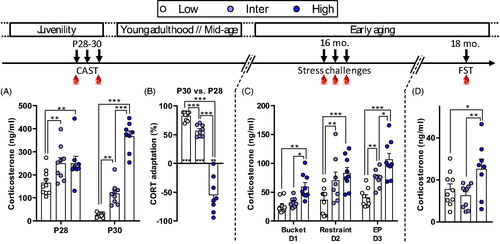
Figure 3. Similar escape latencies during water maze training between the lines, but Inter line animals used “low-level” swimming strategies. (A) All rats showed similar learning and a decrease of the latency to escape the pool between D1–2 and D4–5. (B) Inter line rats had a higher swimming velocity than the Low and High lines. (C–E) The different swimming strategies evaluated with RODA software (Vouros et al., Citation2018). (C) Inter line rats used more the Thigmotaxis strategy compared to Low and High lines during D1–2 of water maze training. There were no differences in Thigmotaxis between the lines on D4–5 (ns). (D) During D1–2 Low line rats did fewer Incursions than High line rats. During D4–5, there was a tendency (# symbol) for a difference between Inter and High lines. (E) Inter line rats used less Self Orienting on D4–5 than both Low and High line animals. Low (n = 10), Inter (n = 9–10), and High (n = 8–9). Asterisks represent statistical differences: #p < .1, *p < .05, **p < .01, ***p < .001, ns, not significant.
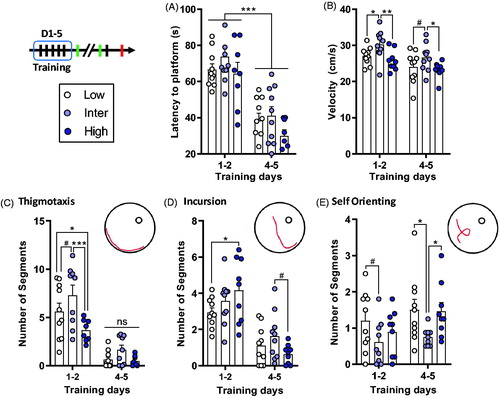
Figure 4. High line rats have better long-term spatial memory retention. (A–C) Results from the first probe trial, performed on D5. (A) The time spent in the target quadrant did not differ between the lines. (B) All rats reached the target location with the same latency. (C) There was no difference in the distance moved during the probe trial on D5. (D–F) Results from the second probe trial, performed on D17. (D) Low line rats spent less time in the target quadrant compared to Inter and High lines. (E) High line rats reached the platform location with a lower latency compared to Low and Inter lines. (F) There was no difference in the total swimming distance. Low (n = 9–10), Inter (n = 9–10), and High (n = 8–9). Asterisks represent statistical differences: *p < .05, ***p < .001.
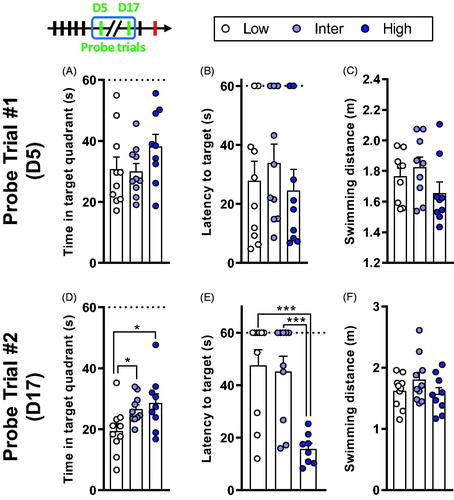
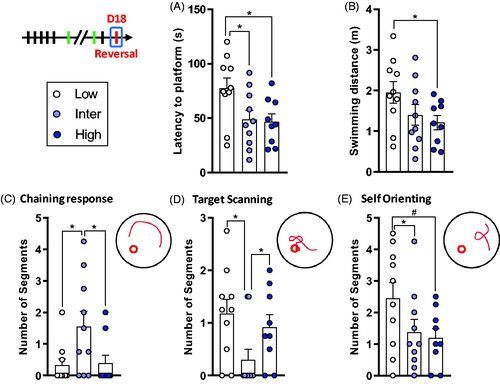
Figure 5. Low line rats show deficits in spatial reversal learning. (A) Latency to find the platform in the new location. Low line rats spent more time to reach the target in comparison to Inter and High lines. (B) There was a tendency for a difference on the distance traveled during reversal training with Low line rats swimming longer distances than High line animals. (C) Inter line rats did more Chaining Responses compared to Low and High lines. (D) Inter line rats did less Target Scanning than Low and High lines. (E) Low line rats had a tendency to Self Orient more than Inter and High lines. Low (n = 10), Inter (n = 10), and High (n = 9). Asterisks represent statistical differences: #p < .1, *p < .05.