
Figures & data
Figure 1. Stressed rats exhibit anxiety-related behavior in the elevated plus maze. Rats exposed to 31 d of psychosocial stress spent significantly less time than non-stressed rats in the open arms of the elevated plus maze (A). Stressed and non-stressed rats had similar numbers of entries into the closed arms, indicating that stress had no significant effect on locomotor activity (B). Data represent the mean ± SEM of 11–12 animals per group.
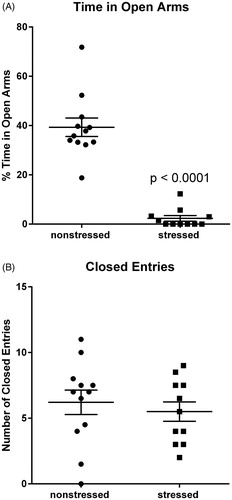
Figure 2. RNA-sequencing of ventricular tissue from stressed and non-stressed rats. Principal component analysis of gene expression profiles indicated that hearts from non-stressed rats have variable baseline gene expression that separated on principal component 1 (PC1), while hearts from all five stressed rats clustered closely and were separated by principal component 2 (PC2) (A). A volcano plot illustrating gene expression alterations and p values for 12,218 genes. Genes of interest are annotated in red (B). Gene ontology analysis identified significantly enriched gene family clusters for upregulated (red) or downregulated (black) genes (C). Genes were ranked in order of most to least enriched in stressed hearts and analyzed by Geneset Enrichment Analysis (GSEA). The enrichment plot shows the normalized enrichment score (NES) for genes associated with endothelial-to-mesenchymal transition (D). Heatmap showing median-centered, log2-fold changes for select upregulated genes identified from Gene Ontology families in panel C (E).
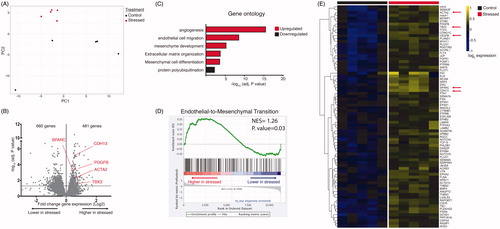
Table 1. Selected changes in the number of mRNA transcripts (normalized counts) for genes in the angiogenesis (GO:0001525) and endothelial cell migration (GO:0043542) gene ontology clusters.
Table 2. Selected changes in the number of mRNA transcripts (normalized counts) for genes in the mesenchyme development (GO:0060485) and mesenchyme differentiation (GO:0048762) gene ontology clusters.
Table 3. Selected changes in the number of mRNA transcripts (normalized counts) for genes in the extracellular matrix assembly (GO:0085029) and extracellular matrix organization (GO:0030198) gene ontology clusters.
Figure 3. Stress induces myocardial lesions characterized by fibrosis, necrosis, and mononuclear cell infiltration. Hearts from stressed and non-stressed rats were evaluated by H&E and Masson’s trichrome staining. Hearts from stressed rats developed multifocal lesions characterized by necrosis (A,D), infiltration by mononuclear immune cells (B,D), and collagen deposition (C,D). Data represent the mean ± SEM of six animals. Representative photographs of heart sections are shown in panel D. Blue circles in photographs of subgross heart images indicate heart regions that were photographed at higher (15.8X) magnification. Scale bars in panel D represent 200 µm.
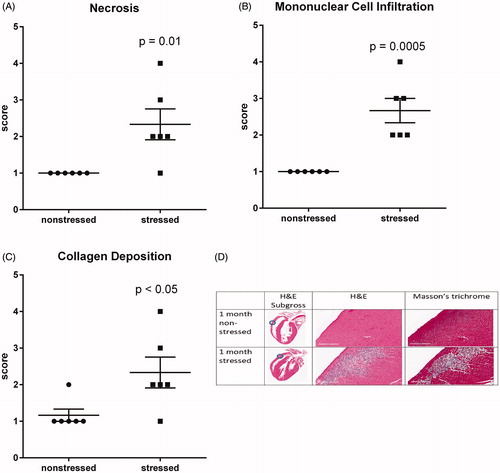
Figure 4. Stress up-regulates myocardial expression of α-smooth muscle actin and T-cadherin. RNA sequencing identified upregulation of mRNA transcripts encoding α-smooth muscle actin (encoded by ACTA2) (A) and T-cadherin (encoded by CDH13) (C) in hearts from rats exposed to 31 d of psychosocial stress compared to hearts from non-stressed rats. Western blots confirmed significant increases in the expression of α-smooth muscle actin (B) and T-cadherin (D) at the protein level. Data in panels A and C represent the mean ± SEM of six hearts. Data in panels B and D represent the mean ± SEM of five hearts.
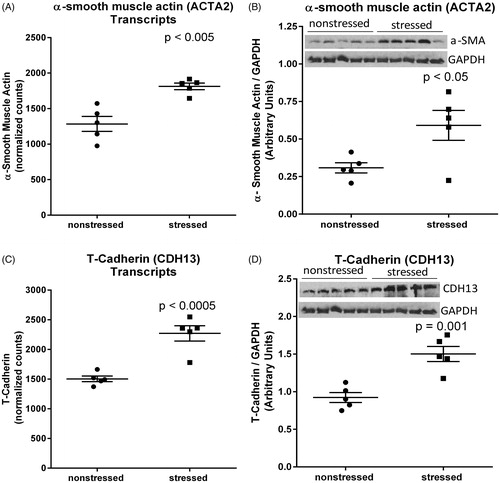
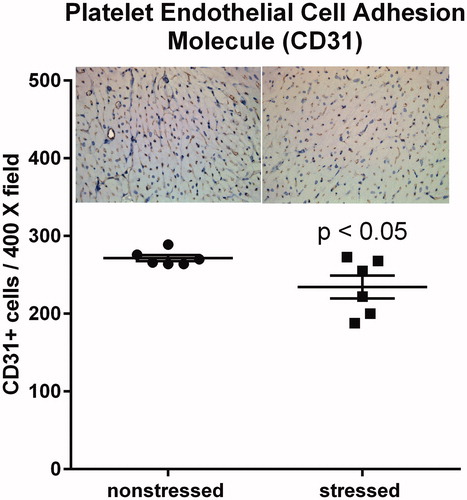
Figure 5. Stressed hearts exhibit a decrease in the number of CD31 positive cells. Predator-based psychosocial stress decreased the number of CD31-positive cells in the ventricular myocardium. Ventricular tissue was stained with a CD31-specific antibody, and the number of CD31 positive cells were counted by in 5 high (400X) magnification fields for each heart by three independent investigators that were blinded to animal treatment. Data represent the mean ± SEM of six hearts for each group.
Data availability statement
Raw data from next-generation sequencing experiments were deposited in the National Center for Biotechnology Information Sequence Read Archive and are available under BioProject ID number PRJNA498684. Differential gene expression analysis of these data is shown at https://figshare.com/s/5f32d3c03635c9bf46f5.