Figures & data
Figure 1. The standardized sampling of the longitudinal, adrenal midsection. h: gland height; w: gland width; l: gland length. Note that by this definition of midsection, it was not necessarily the point where the gland had the largest cross-sectional area.
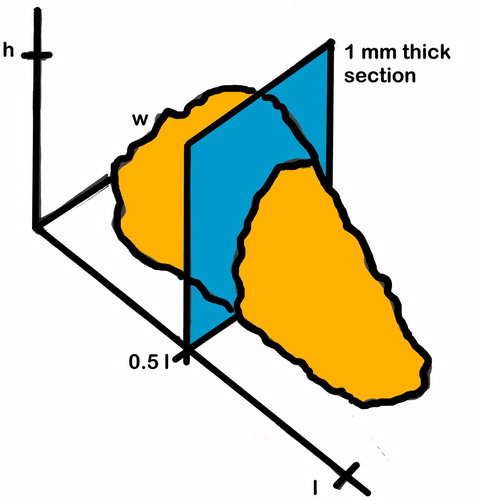
Figure 2. Overview of a super-image of the entire adrenal midsection from one case. Masson’s Trichrome stain. The super-image is a digital composite of individual field of views, generated via automated, sequential capture. Location of current field of view (shown on a second screen connected to the microscope and not visible in this figure) is indicated by the rectangle. The dotted outline is the region of interest (the cross-sectional area), which has been traced by hand.
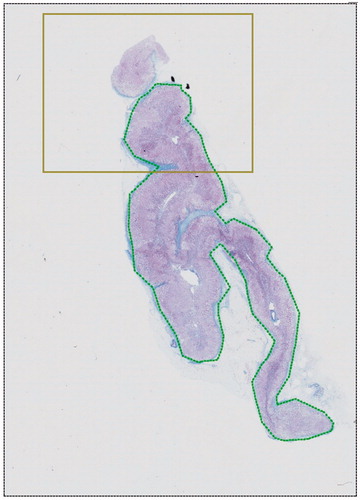
Figure 3. Example of a counting frame. 100× magnification of adrenal midsection with counting markers (crosses, every fourth cross is further marked by a semicircle for better orientation) overlaid. All three cortical zones are visible, but the medulla is not. Approximate zone borders marked by dotted lines. ZG: zona glomerulosa; ZF: zona fasciculata, ZR: zona reticularis. Masson’s Trichrome stain. Scale bar = 100 μm.
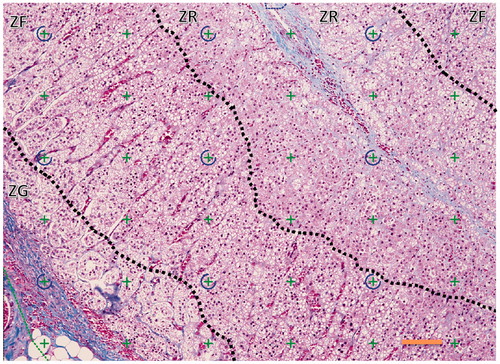
Table 1. Demographic data and maximal postmortem interval for each of the five diagnostic groups.
Table 2. Mean weight and estimated volume of left and right adrenal gland.
Table 3. Mean cross-sectional area of total gland, each cortical zone, and the medulla.
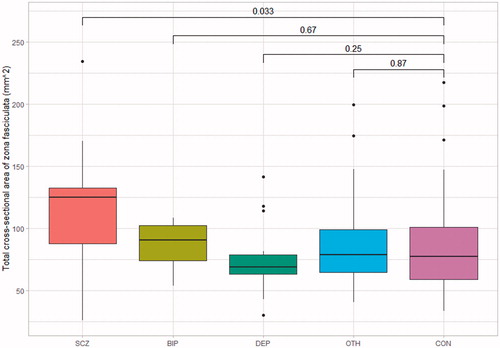
Figure 4. Boxplot showing mean total cross-sectional area (black line), interquartile range (boxes), and 1.5× distance from mean to quartile value (whiskers). Outliers are shown as individual points. Brackets are annotated with calculated p-value from pairwise comparison of means with control group.