
Figures & data
Table 1. Demographic characteristics of the sample.
Figure 1. Illustration of the different experimental conditions. This Figure is being reproduced with the permission of the copyright holder Neuropsychology. Reference of the original source Levy-Gigi et al. (Citation2015). Reduced hippocampal volume is associated with overgeneralization of negative context in individuals with PTSD. Neuropsychology 29(1), 151–161.
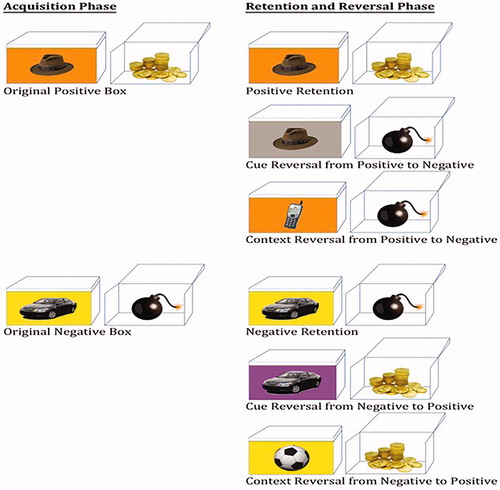
Figure 2. Examples of experimental trials in which participants chose to (a) open a positive outcome box and (b) open a negative-outcome box. This Figure is being reproduced with the permission of the copyright holder Neuropsychology. Reference of the original source Levy-Gigi et al. (Citation2015). Reduced hippocampal volume is associated with overgeneralization of negative context in individuals with PTSD. Neuropsychology 29(1), 151-161.
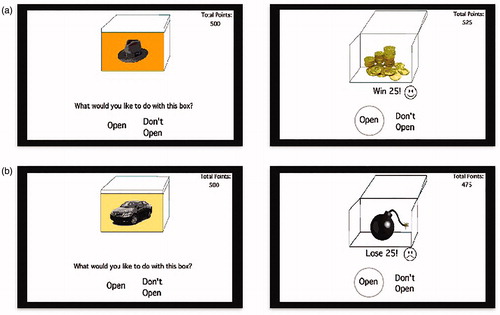
Figure 3. Percentage of correct responses as a function of Phase (acquisition vs. retention) and Valence (positive vs. negative) in the four groups.
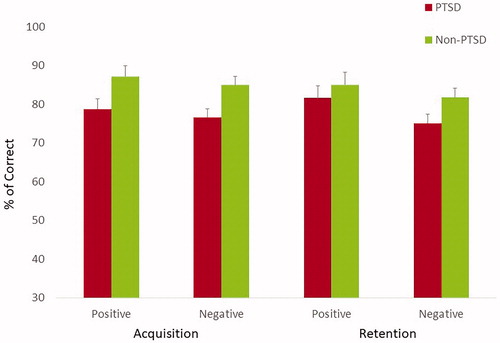
Figure 4. Percentage of correct responses as a function of Reversal Type (cue vs. context), and Reversal Valence (positive to negative vs. negative to positive) in the four groups.
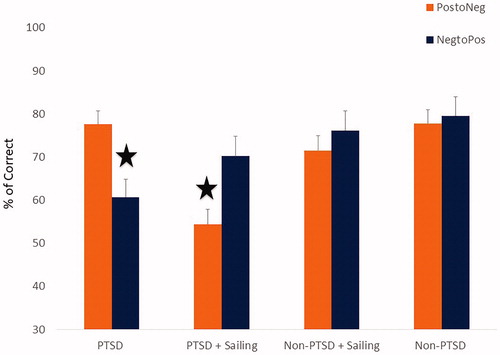
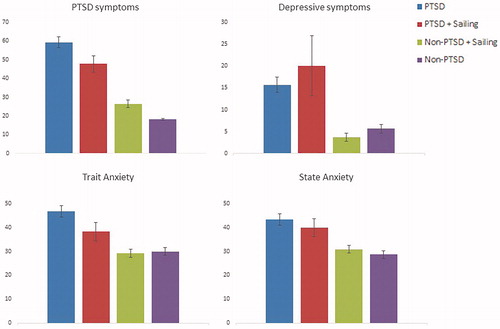
Figure 5. Symptoms severity of PTSD, depression, state and trait anxiety in the four groups.
Data availability statement
The data that support the findings of this study are available from the corresponding author upon request.