Figures & data
Table 1. Number of animals used in the study and in each experimental group.
Figure 1. Experimental outline used for voluntary consumption of ethanol in adolescent and adult Wistar rats subjected to maternal separation (MS) during postnatal day (PND) 2 to 10 for 0, 15, or 180 minutes. The timeline shows the sequence and duration of the experimental protocol.
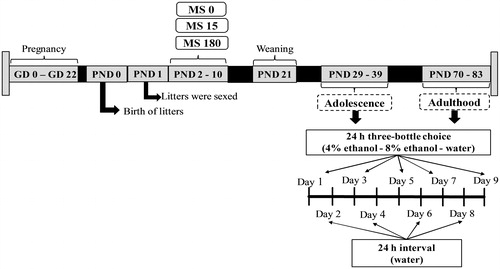
Figure 2. Experimental protocol used for ethanol conditioned place preference (CPP) in adolescent and adult Wistar rats subjected to maternal separation (MS) during postnatal day (PND) 2 to 10 for 0, 15, or 180 minutes. The timeline shows the sequence and duration of experimental protocol.
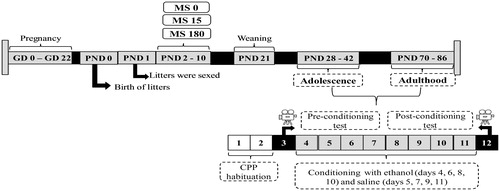
Figure 3. Voluntary ethanol consumption in adolescent rats subjected to brief or prolonged maternal separation during the neonatal period (n = 10–12/group). (A) Total ethanol consumption (g/kg); (B) consumption of ethanol solution at 4% (g/kg); (C) consumption of ethanol solution at 8% (g/kg); (D) water consumption (g/kg). Data represent the mean ± standard error of the mean. ANOVA followed by the Newman Keuls post hoc test. $p ≤ .05 compared to the male groups.
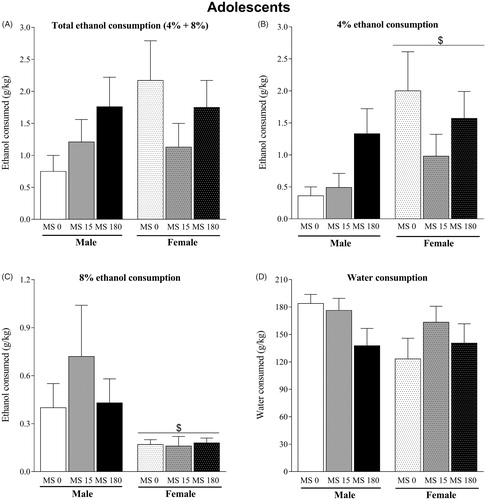
Figure 4. Voluntary ethanol consumption in adult rats subjected to brief or prolonged maternal separation during the neonatal period (n = 10–11/group). (A) total ethanol consumption (g/kg); (B) consumption of ethanol solution at 4% (g/kg); (C) consumption of ethanol solution at 8% (g/kg); (D) water consumption (g/kg). Data represent the mean ± standard error of the mean. ANOVA followed by the Newman Keuls post hoc test. #p ≤ .05, independent of sex, compared to the MS 0 groups; §p ≤ .05, independent of sex, compared to the MS 15 groups; $p ≤ .05 compared to the male groups; &p ≤ .05 compared to the MS 0 male group; †p ≤ .05 compared to the MS 15 male group.
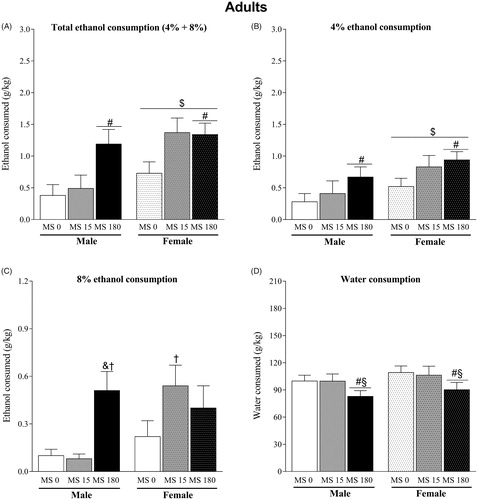
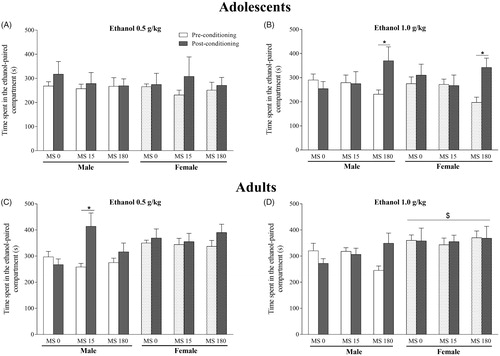
Figure 5. Effects of exposure to neonatal stress on the induction of ethanol-conditioned place preference (CPP) at doses of 0.5 g/kg and 1.0 g/kg. (A) dose of 0.5 g/kg in adolescent rats. (B) dose of 1.0 g/kg in adolescent rats. (C) dose of 0.5 g/kg in adult rats. (D) dose of 1.0 g/kg in adult rats (A). Data represent the mean ± standard error of the mean. Repeated-measures ANOVA followed by the Newman Keuls post hoc test. $p < .05 compared to the male groups; *p < .05 compared to the respective group in the preconditioning test.