Figures & data
Table 1. PCR primers.
Table 2. Full statistical report.
Figure 1. Hippocampal formation. PPS increased expression of (a) FKBP5 and (b) AVPR1a in the female hippocampal formation. Con: control; PPS: pre-pubertal stress; F: female; M: male. Male: 12 control; 10 PPS; female: 8 control; 10 PPS. *p < .05. Error bars represent 1 S.E. and bars joined by a line and asterisk are significantly different to one another.
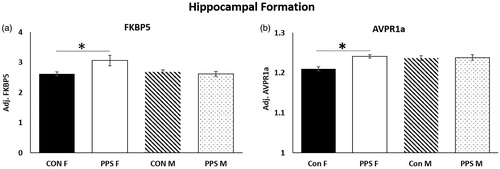
Figure 2. PFC. PPS increased (a) GR and (b) GR:MR ratio and decreased (c) AVPR1a in the female PFC. OXTR expression was higher in female than male PFC. Con: control; PPS: pre-pubertal stress; F: female; M: male. Male: 12 control; 10 PPS; female: 8 control; 10 PPS. *p < .05, **p < .01, ***p < .0001. Error bars represent 1 S.E. and bars joined by a line and asterisk are significantly different to one another.
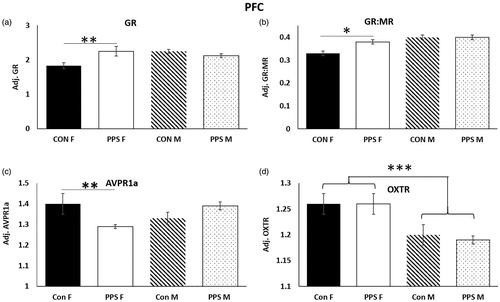
Figure 3. Hypothalamus. (a) GR, (b) MR, (c) GR:MR, (d) FKBP5 and (e) OXTR were higher in male than female hypothalamus, whereas (f) AVPR1a and (g) OXT were higher in female hypothalamus. Con: control; PPS: pre-pubertal stress; F:, female; M: male. Male: 12 control; 10 PPS; female: 8 control; 10 PPS. **p < .01, ***p < .0001. Error bars represent 1 S.E. and bars joined by a line and asterisk are significantly different to one another.
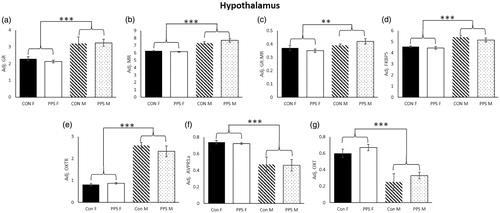
Table 3. Summary of gene expression and CORT changes as a result of PPS and sex differences.
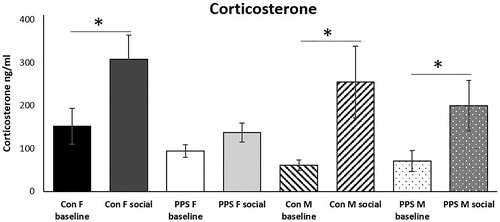
Figure 4. Corticosterone. Social interaction significantly elevated corticosterone above baseline in control animals and PPS males. This response was blunted in PPS females. Con: control; PPS: pre-pubertal stress; F: female; M: male. Females: 22 control; 18 PPS; male: 12 control; 10 PPS *p < .05. Error bars represent 1 S.E. and bars joined by a line and asterisk are significantly different to one another.