Figures & data
Figure 1. Effect of F13A and astressin on ARS-induced accelerated CT. Data are means ± SD. **p < .01 vs NS; #p < .05; ##p < .01 vs vehicle-ARS. The vehicle-treated NS group (white bar) rats were administered with saline and were euthanized 90 min after the phenol red application. Vehicle (500 µl of saline, i.p.), APJ receptor antagonist F13A (300 µg·kg−1, i.p.) or CRF receptor antagonist astressin (100 µg·kg−1, i.p.) was administered 30 min prior to the ARS loading. NS: non-stressed, ARS: acute restraint stress for 90 min. Statistical analyses were performed according to Mann Whitney-U test, n = 6 in all groups. NS: non-stressed, ARS: acute restraint stress for 90 min.
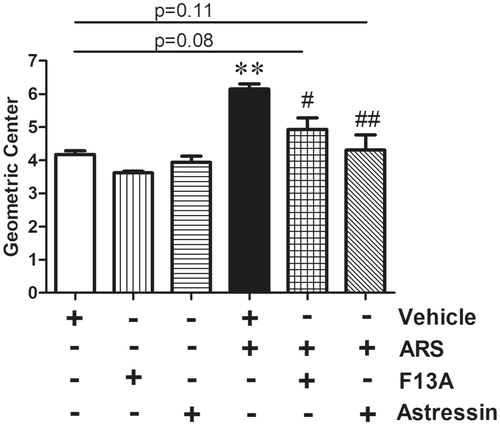
Figure 2. Effect of ARS on CRF immunoreactivities in proximal (A-B) and distal (D-E) colonic sections and quantification of CRF staining in NS and ARS-loaded rats (I). The ganglia in myenteric plexus of a NS (G) and ARS-loaded rat (H) are represented as the higher magnification of the boxed regions. Anti-CRF antibody was replaced by antibody diluent in negative controls (C, F). Scale bars represent 100 µm, n = 3 in all groups, p < .01 vs NS). NS: non-stressed, ARS: acute restraint stress for 90 min.
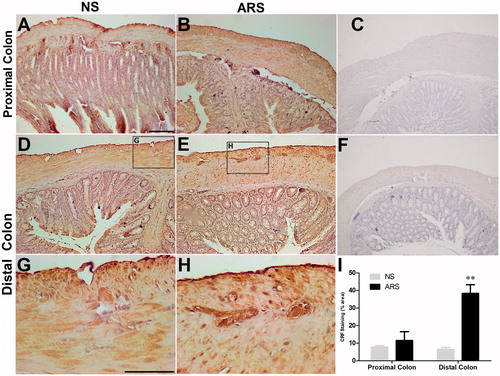
Figure 3. Effect of ARS on apelin (green) immunoreactivity in proximal (A-H) and distal (I-P) coronal colonic sections. PGP9.5 (red) was used to assess the total numbers of neurons in the preparations. TM: tunica muscularis, SM: submucosa, M: mucosa. The scale bars represent 100 µm, n = 3 in all groups. NS: non-stressed, ARS: acute restraint stress for 90 min.
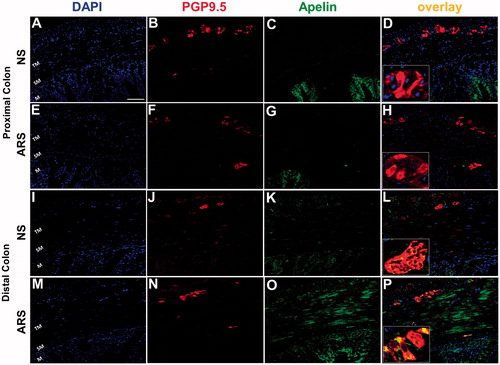
Figure 4. Whole‐mount preparations of distal colonic myenteric neurons obtained from NS (A) and ARS-loaded (B) rats. The quantitative analysis of PGP 9.5 (red)- and apelin (green)-immunoreactive cells (C) in myenteric neurons harvested from distal regions of colon in NS and ARS-loaded rats. Data are means ± SE. **p < .01 vs NS. NS: non-stressed, ARS: acute restraint stress for 90 min. The scale bars represent 200 µm, n = 4 in all groups.
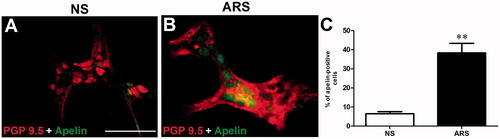
Figure 5. The APJ immunoreactivity in proximal (A-C) and distal (D-F) coronal colonic sections and its quantitative analysis (G). Changes in nuclear morphology were observed by DAPI. TM: tunica muscularis, SM: Submucosa, M: Mucosa. Scale bars represent 100 µm, n = 5 in all groups.
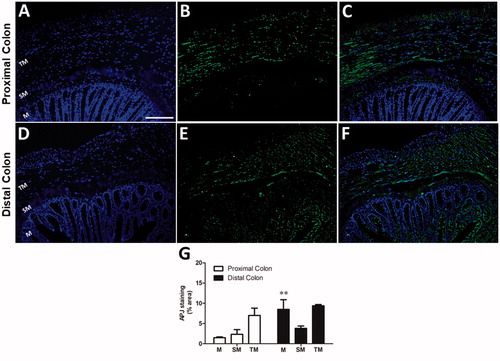
Figure 6. Proportion of neuronal cells coexpressing of CRF1 with apelin or APJ receptor in distal colonic whole-mount LMMP preparations. PGP 9.5 (blue) was used to assess the total number of neurons in the preparations. Digital merger of B-C and F-G revealed the coexpression of apelin (green)/CRF1 (red) or APJ (green)/CRF1 (red) in myenteric ganglia, respectively. The scale bar represents 100 µm, n = 3 in all groups.
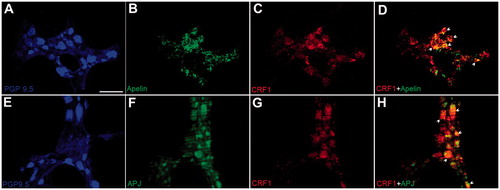
Table 1. Neuronal cells immunoreactive to both CRF1 and apelin or APJ receptor in distal colonic whole-mount LMMP preparations were harvested from NS (n = 4) and ARS-loaded (n = 4) rats.
Figure 7. The effect of peripherally administered apelin-13 on in-vivo colonic motility in anesthetized rats. Representative traces showing the response of the proximal (A) and distal (B) colon to apelin-13 (100 μg·kg−1, i.v., n = 5). The black arrow represents the injection performed after recording a basal motor. The gray area and the dashed line represent the rapid stimulatory and long-lasting inhibitory phases, respectively.
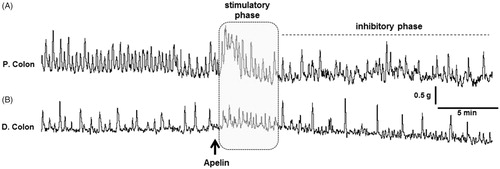
Figure 8. The effect of peripheral CRF administration on in-vivo colonic motility in anesthetized rats. Representative traces showing the response of the proximal and distal colon to CRF (100 μg·kg−1, i.v., n = 5) (A) and the alterations in response to APJ receptor antagonist F13A (300 μg·kg−1, i.v., n = 5) (B). The AUC was calculated as MI within equal pre- and post-injection time periods and expressed as % change (C). The black arrows represent the injections. Data are means ± SE. *p < .05; **p < .01 vs CRF.
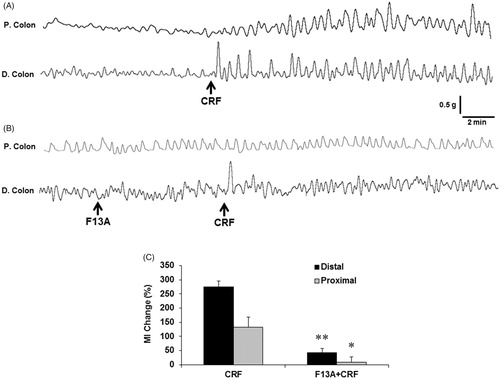
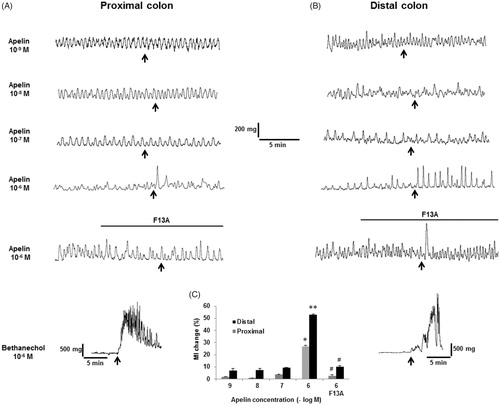
Figure 9. In-vitro assessment of the effect of apelin-13 on colonic smooth muscle preparations. Representative traces showing the response of the proximal (A) and distal (B) colon preparations. Pretreatment of F13A (10−6 M) blocked the stimulatory effect of 10−6 M apelin-13 on contractions and MI (C). Treatment of 10−6 M carbachol caused remarkable smooth muscle contractions in both colonic segments. *p < .05; **p < .01 vs lower apelin concentrations, #p < .05; ##p < .01 vs 10−6 M apelin-13, n = 4 in all groups.