
Figures & data
Figure 1. The chemical structure of alkylglycerols. (A) Chimyl alcohol and (B) batyl alcohol.
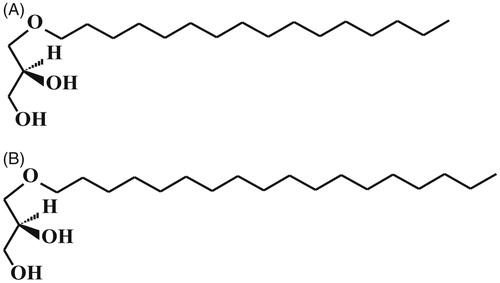
Table 1. AG composition after double crystallization.
Figure 2. Blood catalase activity of non-stressed and stressed rats. The values are reported as the median, [![]()
![Figure 2. Blood catalase activity of non-stressed and stressed rats. The values are reported as the median, [Display full size]- 25–75%,[Display full size]- range without ejection, **p = 0.016 (valid), Mann–Whitney U test (comparison between stressed group AGs 15 mg/kg and stressed group AGs 157 mg/kg); Kendall correlation, K = 0.78 (stressed groups); Kruskal–Wallis test (p = 0.024).](/cms/asset/6ecd2adb-84f3-4f8a-8ea8-df6b515df9ae/ists_a_1660316_f0002_b.jpg)
Figure 3. Hemoglobin level of non-stressed and stressed rats. The values are reported as the median, [![]()
![Figure 3. Hemoglobin level of non-stressed and stressed rats. The values are reported as the median, [Display full size]- 25–75%,[Display full size]- range without ejection, *extreme; Kruskal–Wallis test (p = 0.03).](/cms/asset/8b868d2e-f23c-4cb9-80ee-92cde44431a3/ists_a_1660316_f0003_b.jpg)
Figure 4. Effect of AGs on body weight of non-stressed rats. The values are reported as the median, [![]()
![Figure 4. Effect of AGs on body weight of non-stressed rats. The values are reported as the median, [Display full size]- 25–75%,[Display full size]- range without ejection, °- emissions; **p = 0.00018 (valid) Mann–Whitney U test (comparison between control group and AGs 157 mg/kg); Kendall correlation (K = −0.53); Kruskal–Wallis test (p = 0.001).](/cms/asset/33453455-b753-450f-a217-4a3f328abace/ists_a_1660316_f0004_b.jpg)
Figure 5. The adrenal gland index in stressed rats. The values are reported as the median, [![]()
![Figure 5. The adrenal gland index in stressed rats. The values are reported as the median, [Display full size]- 25–75%,[Display full size]- range without ejection; **p = 0.016 (valid) Mann–Whitney U test (comparison between stressed group AGs 15 mg/kg and stressed group AGs 157 mg/kg); Kendall correlation, K = 0.81; Kruskal–Wallis test (p = 0.01).](/cms/asset/218bec73-d136-4a97-82f0-dc2ee7e8459f/ists_a_1660316_f0005_b.jpg)
Supplemental material