Figures & data
Table 1. Baseline means arterial pressure (MAP), heart rate (HR), before treatment (i.v.), and before osmotic stimulation.
Figure 1. (A) Time course of the mean arterial pressure (ΔMAP) and heart rate (ΔHR) responses observed after intraperitoneal (i.p.) injection of isotonic saline (0.15 M NaCl, n = 4) or hypertonic saline (0.6 M NaCl, n = 4). The onset of osmotic stimulation (OS) was at time 0 min. (*) indicates significantly different from control, Two-way ANOVA, P < 0.05. (B) Representative recordings of mean arterial pressure (MAP), pulsatile arterial pressure (PAP) and heart rate (HR) showing the cardiovascular effects to OS i.p. injection (0.6 M NaCl) in one unanesthetized rat. The onset of OS i.p. injection is indicated by an arrow at time 0 min.
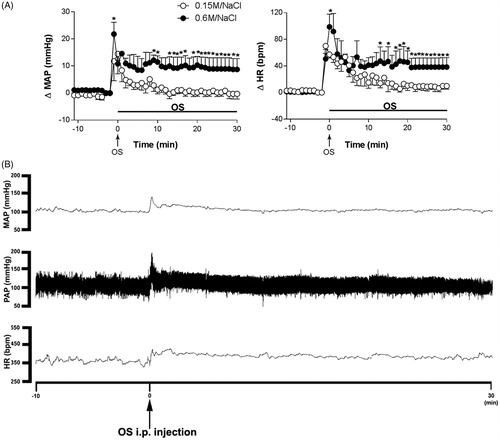
Figure 2. Plasma osmolality, plasma NaCl concentration, urinary volume, and NaCl concentration were measured 30min after the onset of OS with either i.p. injection of isotonic saline (0.15 M NaCl, n = 5) or hypertonic saline (0.6 M NaCl, n = 6) in conscious rats. (*) indicates significant difference, Student's t-test, P < 0.05.
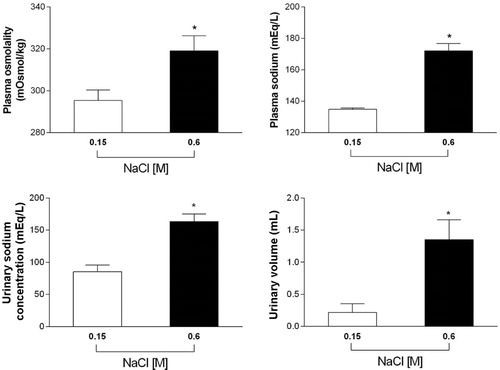
Figure 3. Left -Time course curves of mean arterial pressure (MAP) and heart rate (HR) responses observed after acute OS i.p. injection (0.6 M NaCl) in animals pretreated with either vehicle solution (1 mL/kg i.v. n = 8) or pentolinium (5 mg/kg, i.v. n = 5). Right - Time course showing absolute mean arterial pressure MAP and HR values. Left - Time course showing changes in mean arterial pressure (ΔMAP) and heart rate (ΔHR) responses. Drugs were injected at the time -10 min. The onset of OS was at time 0min. (*) indicates significantly different from control, Two-way ANOVA, P < 0.05.
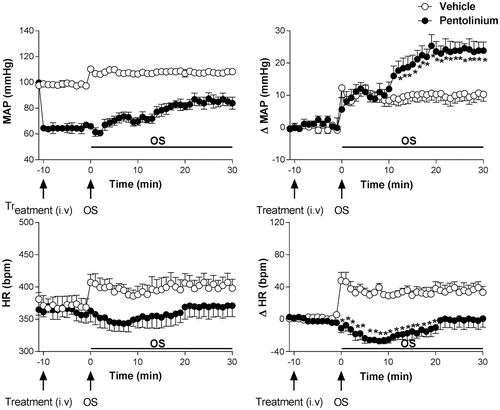
Figure 4. Time course curves of mean arterial pressure (ΔMAP) and heart rate (ΔHR) responses observed after acute OS i.p. injection (0.6 M NaCl) in animals pretreated with either vehicle (1 mL/kg i.v. n = 6) or prazosin (0.5 mg/kg, i.v. n = 5). Drugs were injected at the time -10 min. The onset of OS was at time 0 min. (*) indicates significantly different from control, Two-way ANOVA, P < 0.05.
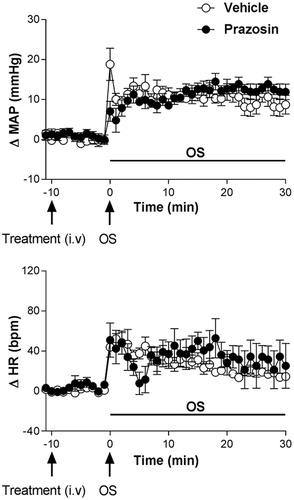
Figure 5. Time course curves of mean arterial pressure (ΔMAP) and heart rate (ΔHR) responses observed after acute OS i.p. injection (0.6 M NaCl) in animals pretreated with either vehicle (1 mL/kg i.v. n = 6) or atenolol (1 mg/kg, i.v. n = 4). Drugs were injected at the time -10 min. The onset of OS was at time 0 min. (*) indicates significantly different from control, Two-way ANOVA, P < 0.05.
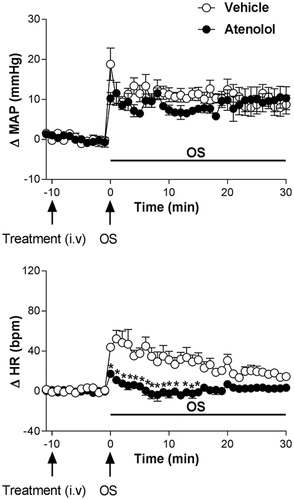
Figure 6. Time course curves of mean arterial pressure (ΔMAP) and heart rate (ΔHR) responses observed after acute OS i.p. injection (0.6 M NaCl) in animals pretreated with either vehicle (1 mL/kg i.v. n = 6) or dTyr(CH2)5(Me)AVP (50 μg/kg, i.v. n = 6). Drugs were injected at the time -10 min. The onset of OS was at time 0 min. (*) indicates significantly different from control, Two-way ANOVA, P < 0.05.
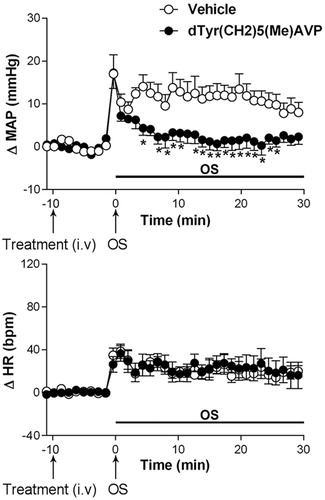
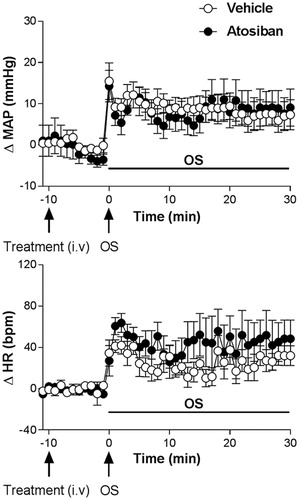
Figure 7. Time course curves of mean arterial pressure (ΔMAP) and heart rate (ΔHR) responses observed after acute OS i.p. injection (0.6 M NaCl) in animals pretreated with either vehicle (1 mL/kg i.v. n=6) or Atosiban (10 μg/kg, i.v. n = 5). Drugs were injected at the time -10 min. The onset of OS was at time 0 min. (*) indicates significantly different from control, Two-way ANOVA, P < 0.05.