
Figures & data
Figure 1. Bar graphs depicting the distribution of perceived discrimination attributions by race. Only participants reporting perceived discrimination at least "a few times a year" or more were asked to report attributions (N = 80). Race/Ances: Race/Ancestry; Physical App: Physical Appearance; Educ/Income: Education/Income; Sexual Orient: Sexual Orientation. **p < 0.01; ***p < 0.001.
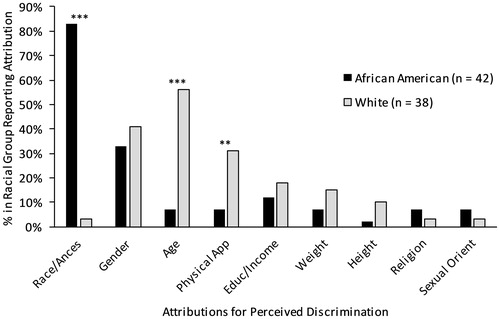
Table 1. Descriptive information of the study sample.
Table 2. Bivariate correlations among variables involved in inferential analyses (N = 141).
Figure 2. Simple slopes depicting the association between perceived everyday discrimination and hair cortisol concentration for White and African American participants (N = 141). **p < 0.01.
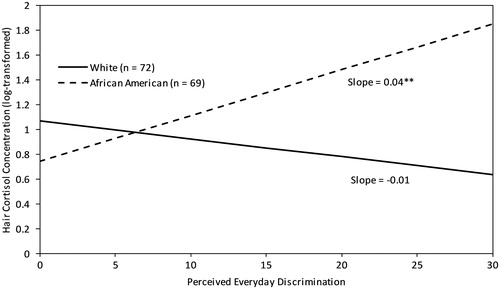
Table 3. Standardized coefficients from regression models predicting log-hair cortisol concentration (N = 141).