Figures & data
Figure 1. Weight gain relative to baseline weight of pair- and single-housed male mice after six-week exposure to chronic variable stress (CVS) or control conditions. Each bar represents mean ± SEM, and numbers within each bar indicate the number of animals used for each group. ####: p < .0001 for a main effect of CVS.
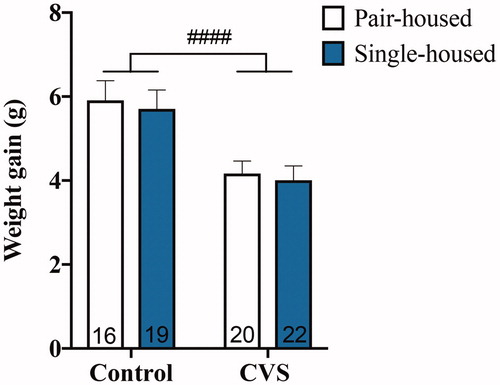
Figure 2. Adrenal weights (% of body weight (a); total (b)) of pair- or single-housed male mice exposed to six weeks of chronic variable stress (CVS) or control conditions. Each bar represents mean ± SEM, and numbers within each bar indicate the number of animals used for each group.
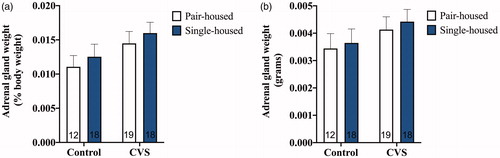
Figure 3. Plasma corticosterone (CORT) levels at baseline and 20 minutes after the initiation of restraint stress in control or chronic variable stress (CVS)-treated pair- versus single-housed male mice. Each bar represents mean ± SEM, and numbers within each bar indicate the number of animals used for each group. ***: p < .001 for restrained single-housed CVS-treated versus restrained single-housed control animals.
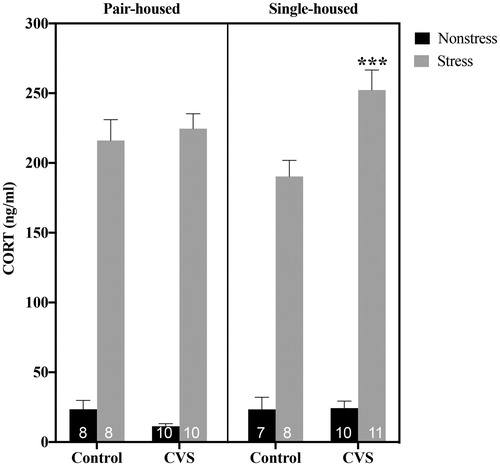
Figure 4. Levels of arginine vassopressin (AVP) mRNA at baseline and after 20 minutes of restraint stress within the paraventricular nucleus (PVN) (a,b) and supraoptic nucleus (SON) (c,d) of pair- versus single-housed male mice exposed to chronic variable stress (CVS) or control conditions. Arbitrary density units (ADUs) calculated from in situ hybridization autoradiograms of AVP mRNA are shown in panels a and c. Each bar represents mean ± SEM, and numbers within each bar indicate the number of animals used for each group. #: p < .05 for a main effect of CVS present in single-, but not pair-, housed mice; *: p < .05 for stressed CVS-treated versus stressed control-treated single-housed males. Panels b and d show representative autoradiograms of AVP hybridization in the PVN (b) and SON (d) of single-housed mice; 3V: third ventricle.
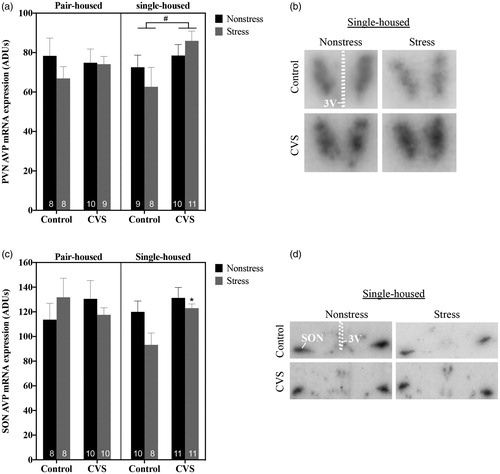
Figure 5. Levels of hypothalamic oxytocin (OT) mRNA and plasma OT at baseline and after 20 minutes of restraint stress in pair- versus single-housed male mice exposed to chronic variable stress (CVS) or control conditions. Panels a and b show mean ± SEM arbitrary density units (ADUs) calculated from in situ hybridization autoradiograms of OT mRNA within the paraventricular nucleus (PVN) (a) and supraoptic nucleus (SON) (b). Panel c shows mean ± SEM plasma OT levels in pair- versus single-housed mice. *: p < .05 for stressed versus nonstressed control single-housed males. Numbers within each bar indicate the number of animals used for each group.
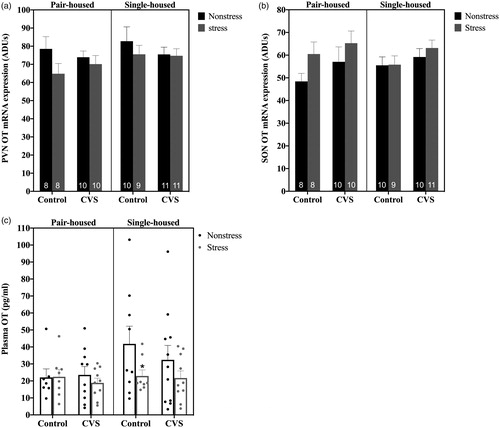
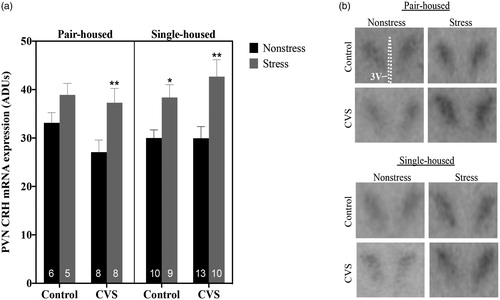
Figure 6. Levels of corticotropin releasing hormone (CRH) mRNA at baseline or after 20 minutes of restraint stress within the paraventricular nucleus (PVN) of pair- versus single-housed male mice exposed to chronic variable stress (CVS) or control conditions. Arbitrary density units (ADUs) calculated from in situ hybridization autoradiograms of CRH mRNA are shown in panel a. Each bar represents mean ± SEM, and numbers within each bar indicate the number of animals used for each group. *: p < .05; **: p < .01 for restraint stressed males versus non-stressed males of the same treatment and housing condition. Panel b shows representative autoradiograms of CRH hybridization in the PVN of pair- and single-housed male mice; 3V: third ventricle.