
Figures & data
Figure 1. The full list of available biomarkers was refined into a final list of biomarkers to include in an allostatic load index using a combination of forward stepwise regression and independent biomarker associations. Biomarkers with a tolerance statistic >0.20 that associated independently with fewer than 25% of project variables were removed from the allostatic load index; those that met only one criterion also were considered for removal.
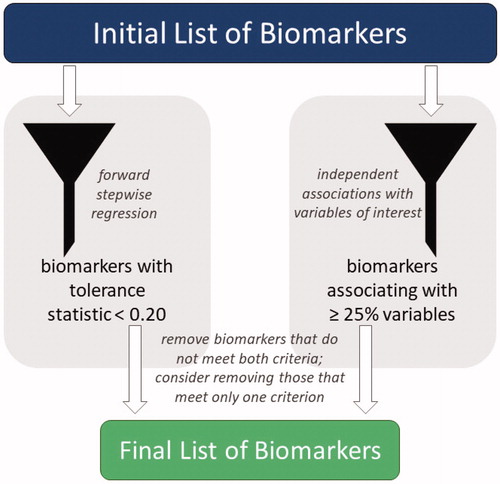
Table 1. High-risk quartile boundaries for biomarkers included in allostatic load indices combined using a one-tailed quartile approach and a multi-method, split quartile approach (top and bottom 12.5%) for cortisol.
Table 2. Means, standard deviations, and ranges for each allostatic load index tested in western lowland gorillas (n = 63), as well as associations of allostatic load with age (linear regression) and sex (t-test).
Figure 2. Relative risk of developing at least one chronic condition in western lowland gorillas for each allostatic load index tested. Error bars represent 95% confidence intervals. ALI: allostatic load index; ALM: allostatic load index constructed with a multi-method approach; ALQ: allostatic load index constructed with traditional one-tailed quartiles; PS1: pooled sample 1; PS2: pooled sample 2.
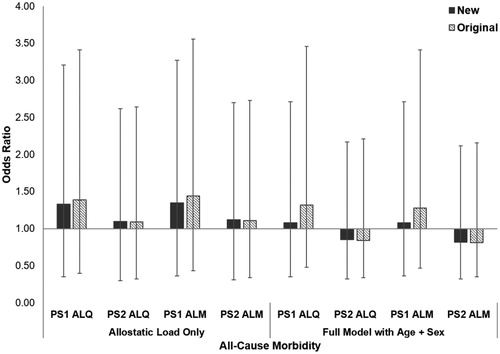
Table 3 Risk of all-cause morbidity in western lowland gorillas (n = 63) was analyzed using binomial generalized linear models (GLMs) with logit links for a baseline model with age and sex only, a model with each allostatic load index only, and a full model with allostatic load and significant variables from the baseline model.
Figure 3. Relative risk of developing cardiac disease in western lowland gorillas for each allostatic load index tested. Error bars represent 95% confidence intervals. ALI: allostatic load index; ALM: allostatic load index constructed with a multi-method approach; ALQ: allostatic load index constructed with traditional one-tailed quartiles; PS1: pooled sample 1; PS2: pooled sample 2.
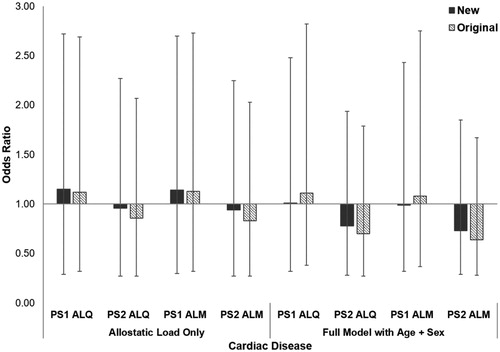
Table 4. Risk of cardiac disease in western lowland gorillas (n = 63) was analyzed using binomial generalized linear models (GLMs) with logit links for a baseline model with age and sex only, a model with each allostatic load index only, and a full model with allostatic load and significant variables from the baseline model.
Figure 4. Relative risk of mortality in western lowland gorillas for each allostatic load index tested. Error bars represent 95% confidence intervals. ALI: allostatic load index; ALM: allostatic load index constructed with a multi-method approach; ALQ: allostatic load index constructed with traditional one-tailed quartiles; PS1: pooled sample 1; PS2: pooled sample 2.
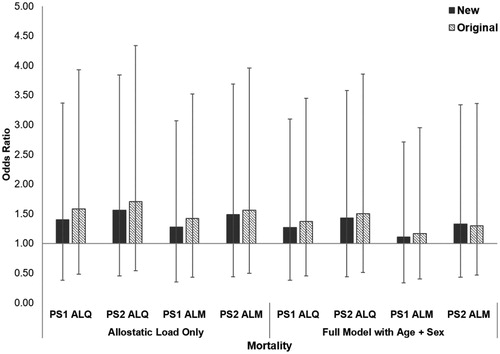
Table 5. Risk of mortality in western lowland gorillas (n = 63) was analyzed using binomial generalized linear models (GLMs) with logit links for a baseline model with age and sex only, a model with each allostatic load index only, and a full model with allostatic load and significant variables from the baseline model.
Data availability
Data supporting the findings of this study are available on request from the corresponding author, ANE. Individually identifiable data are not publicly available due to confidential agreements made between the corresponding author, ANE, and each cooperating zoological institution.