
Figures & data
Figure 1. Outline of recording session 1 (day 0).
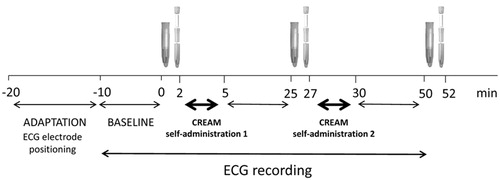
Figure 2. Outline of recording session 2 (day 29).
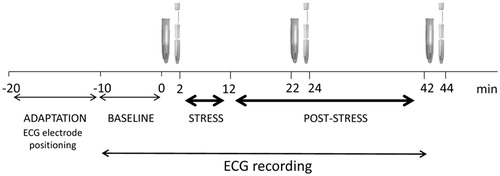
Figure 3. Flowchart of the study procedures.
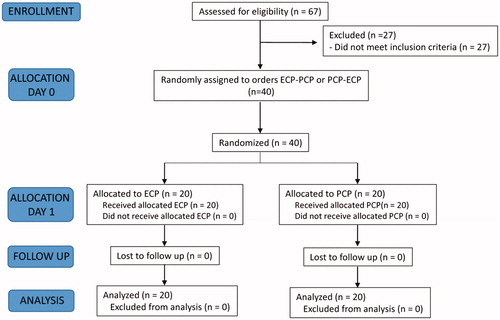
Table 1. Antropometric, lifestyle and psychometric characteristics of ECP (enriched cosmetic product) and PCP (placebo cosmetic product) women at the beginning of the study.
Table 2. Partial and overall POMS (Profile of Mood States) scores for ECP (enriched cosmetic product) and PCP (placebo cosmetic product) women, expressed as difference values between day29 and day-2 scores.
Figure 4. Scores of non verbal behavior categories exhibited during the SI (stress interview) phase of the PST (psychosocial stress test) by PCP (placebo cosmetic product) and ECP (enriched cosmetic product) women. EC: eye contact; AF: affiliation; SUB: submission; FLIG: flight; ASS: assertion; DISP: displacement; RELAX: relaxation; GEST: gesture. *p < .05 and §p < .01 vs. placebo.
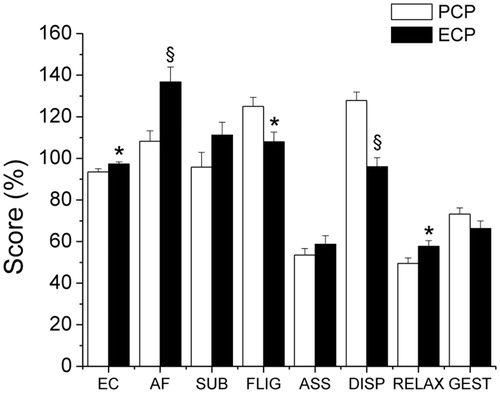
Figure 5. Heart rate, heart rate variability (HFnu and LF/HF), and saliva cortisol values obtained before and after the first self-administration of the two cosmetic products (recording session 1, day 0). HF(n.u.): high frequency band power in normalized units; LF: low frequency band power. *p < .05 vs. baseline; #p < .05 vs. placebo.
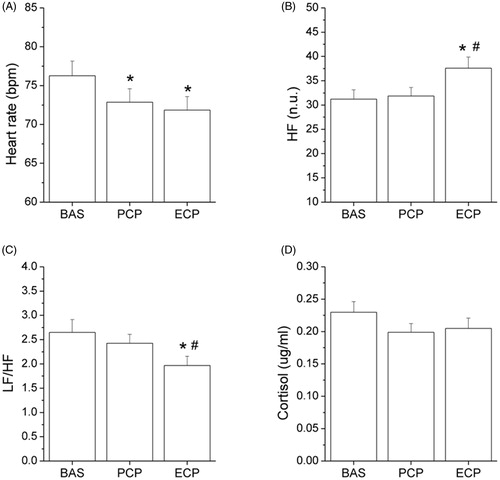
Figure 6. Heart rate, heart rate variability (HFnu and LF/HF), and saliva cortisol values obtained before, during and after the psychosocial stress test (PST, recording session 2, day 29), from ECP (enriched cosmetic product) and PCP (placebo cosmetic product) women. HF(n.u.): high frequency band power in normalized units; LF: low frequency band power; bas: baseline, mean value of the two 5-min recording epochs in resting conditions; s1 and s2: first (stress interview) and second (arithmetic task) phases of the PST; r1–r6: consecutive 5-min recording epochs of the post-stress (recovery) phase. *p < .05 vs. baseline; #p < .05 vs. placebo.
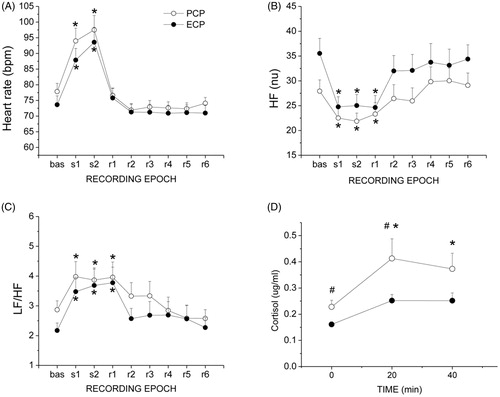
Table 3. Changes in baseline values for heart rate (HR), high frequency band power (HFnu), LF/HF ratio, and cortisol levels, following 4-week self-administration of the placebo (PCP) or enriched (ECP) cosmetic product.