Figures & data
Figure 1. Serum biochemical measurements in bile duct ligated (BDL) rats. NAC: N-acetyl cysteine. Data are given as mean ± SD (n = 8). ***Significantly different as compared with the control group (p < 0.001). aSignificantly different as compared with the BDL group (p < 0.001). ns: not significant as compared with the control group.
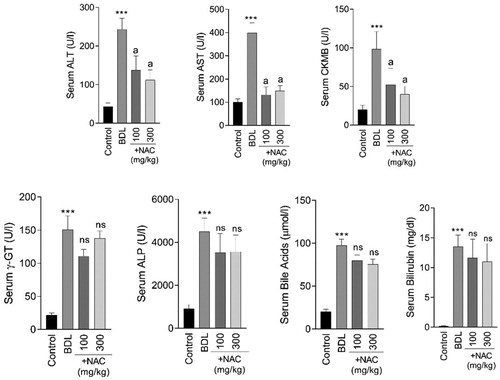
Figure 2. Organ weight index in cirrhotic rats. Columns of weight index for each organ indicate sham-operated, BDL, BDL + NAC 100 mg/kg, and BDL + NAC 300 mg/kg respectively (left to right). Data are represented as mean ± SD (n = 8). Asterisks indicate significantly different as compared with the control group (*p < 0.05, **p < 0.01). aIndicates significantly different as compared with the BDL group (p < 0.01). ns: not significant as compared with the BDL group.
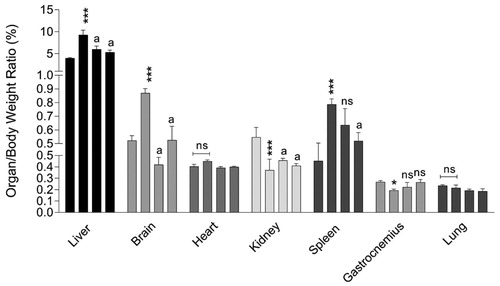
Figure 3. Markers of oxidative stress in the brain tissue of cirrhotic animals. BDL: Bile duct ligated; NAC: N-acetyl cysteine. Data are represented as mean ± SD (n = 8). ***Significantly different as compared with the control group (p < 0.001). aSignificantly different as compared with the BDL group (p < 0.001). ns: not significant as compared with the BDL group.
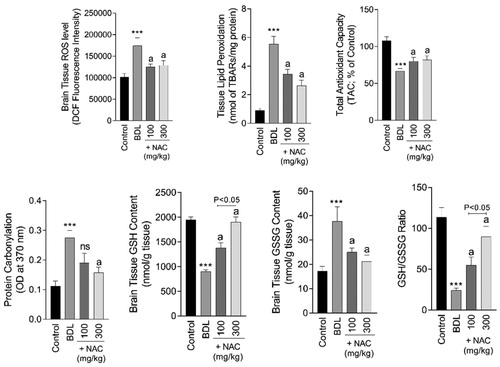
Figure 4. Effect of N-acetyl cysteine (NAC) supplementation on the cirrhosis-associated heart tissue injury and oxidative stress. BDL: Bile duct ligated. Data are represented as mean ± SD (n = 8). ***Indicates significantly different as compared with the control group (p < 0.001). aIndicates significantly different as compared with the BDL group (p < 0.001).
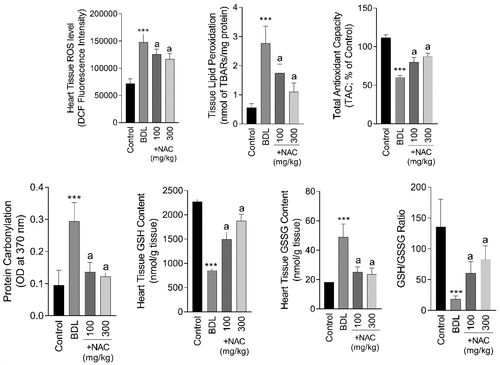
Figure 5. N-acetyl cysteine (NAC) supplementation mitigates biomarkers of oxidative stress in the liver of bile duct ligated (BDL) rats. Data are represented as mean ± SD (n = 8). ***Significantly different as compared with the control group (p < 0.001). aSignificantly different as compared with the BDL group (p < 0.001).
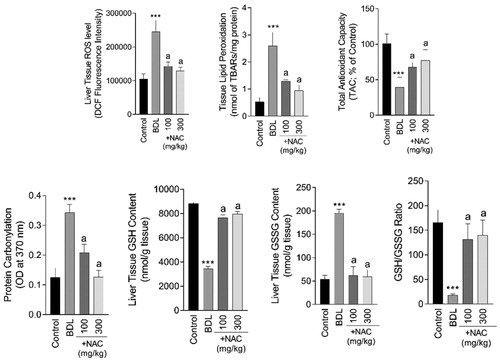
Figure 6. Effect of N-acetyl cysteine (NAC) on kidney tissue markers of oxidative stress in cirrhotic animals. BDL: Bile duct ligated. Data are represented as mean ± SD (n = 8). ***Indicates significantly different as compared with the control group (p < 0.001). aIndicates significantly different as compared with the BDL group (p < 0.001).
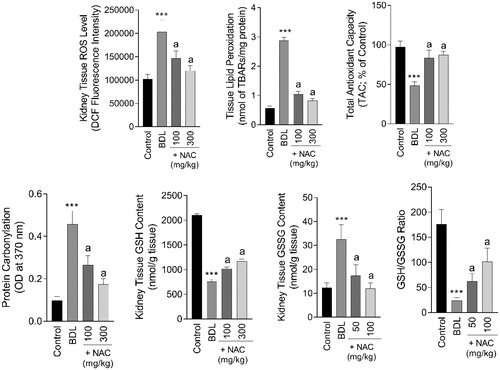
Figure 7. Biomarkers of oxidative stress in cirrhotic rats’ skeletal muscle (Gastrocnemius). NAC: N-acetyl cysteine; BDL: Bile duct ligation. Data are represented as mean ± SD (n = 8). ***Significantly different as compared with the control group (p < 0.001). a,bSignificantly different as compared with the BDL group (p < 0.001 and p < 0.05 respectively). ns: not significant as compared with the BDL group.
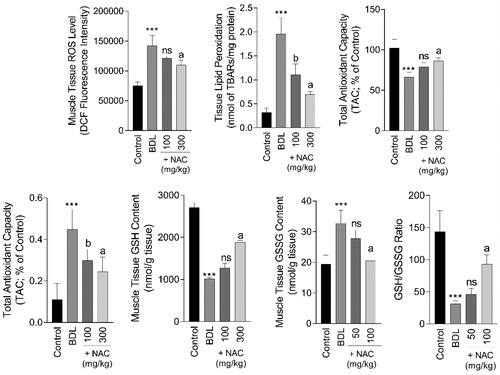
Figure 8. N-acetyl cysteine (NAC) mitigates lung tissue injury in cirrhotic animals. BDL: Bile duct ligated. Data are represented as mean ± SD (n = 8). ***Significantly different as compared with the control group (p < 0.001). aIndicates significantly different as compared with the BDL group (p < 0.001).
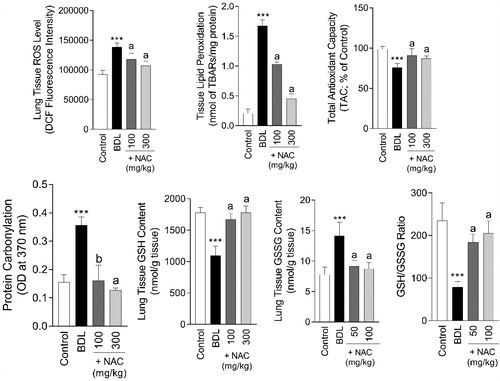
Figure 9. Biomarkers of oxidative stress in the serum of cirrhotic animals. BDL: Bile duct ligated. Data are represented as mean ± SD (n = 8). ***Indicates significantly different as compared with the control group (p < 0.001). aSignificantly different as compared with the BDL group (p < 0.001).
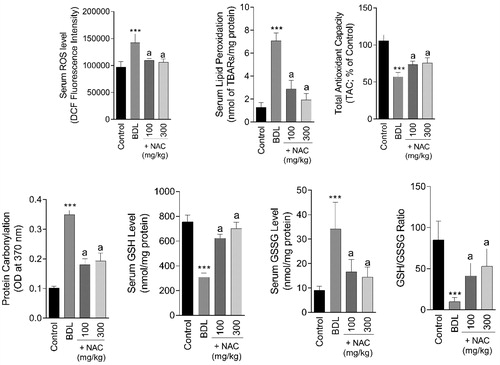
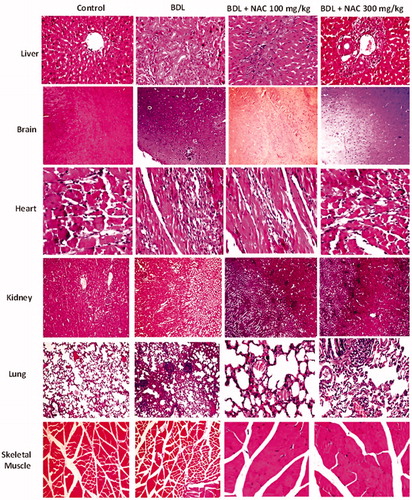
Figure 10. Effect of N-acetylcysteine (NAC) treatment on tissue histopathological changes in bile duct ligated (BDL) animal model of cirrhosis. Significant histopathological alterations were evident in different tissues of BDL animals (Supplementary file, Table 1). It was found that NAC supplementation (100 and 300 mg/kg) provided an ameliorative effect on BDL-associated tissue histopathological changes (Supplementary file, Table 1).