Figures & data
Figure 1. Schematic representations of the experimental procedures in single (A) and repeated (B) restraint protocols.
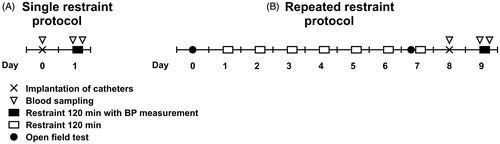
Table 1. The relative adrenal and thymus weights in F344 and LEW rats exposed to a single or to a repeated restraint stress.
Figure 2. The effect of single and repeated restraint on the cardiovascular response in F344 and LEW rats. The time-course of mean arterial pressure (A, B) and heart rate (C, D) during single (A, C) and repeated (B, D) restraint. Each point represents a group mean ± SEM of the averaged 5-min interval; n = 6–7 for F344 rats, n = 7–8 for LEW rats. The main effects of strain (LEW vs. F344 rats) and time (within-animal repeated factor) were tested by repeated measures two-way ANOVA and the results are listed below each graph. Bonferroni post hoc test was performed.
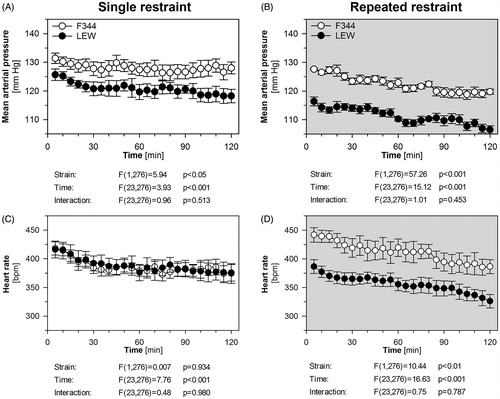
Figure 3. The blood pressure and heart rate response of F344 and LEW rats to the intravenous administration of sodium nitroprusside and phenylephrine after single restraint (A) and repeated restraint (B). Baroreceptor-heart rate reflex sensitivity was calculated as the slopes of regression lines separately for the nitroprusside-induced tachycardia and for the phenylephrine-induced bradycardia. Each point represents a group mean ± SEM, n = 6–7 for F344 rats, n = 5–6 for LEW rats. The slopes of baroreflex sensitivity were analyzed using two-way ANOVA with main effects of strain (LEW vs. F344 rats) and baroreflex arm (tachycardic vs. bradycardic response) and the results are listed below each graph. Bonferroni post hoc test was performed.
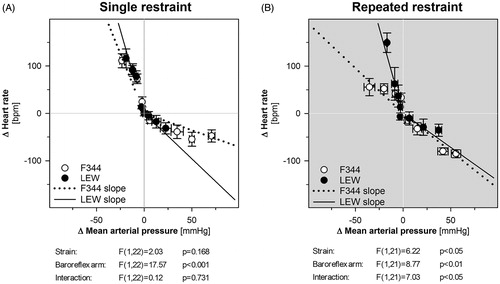
Table 2. The basal plasma levels of ACTH, corticosterone, aldosterone, and adrenaline in absolute control (stress-naïve) and adapted control (7× restraint and 1-day recovery) F344 and LEW rats.
Figure 4. The effect of single and repeated restraint on the plasma hormone levels in F344 and LEW rats. Adrenocorticotropic hormone (ACTH; A, B), corticosterone (C, D), aldosterone (E, F), and adrenaline (G, H) in single (left panels) and repeated (right panels) restraint protocol. Results are expressed as group means ± SEM; n = 6–8 for F344 rats, n = 7–8 for LEW rats. Plasma hormone levels were analyzed using two-way ANOVA with the main effects of strain (LEW vs. F344 rats) and stress (stress-naive vs. 10 min restraint or 120 min restraint), the results are listed below each graph. Bonferroni post hoc test was performed, *p < .05 versus respective control group, †p < .05 F344 versus LEW rats.
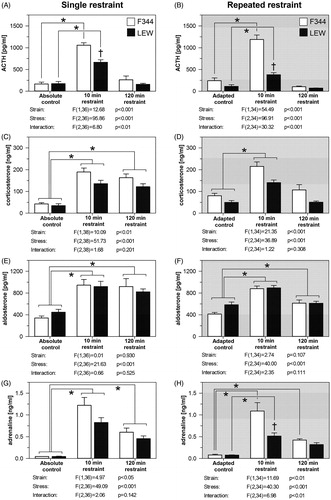
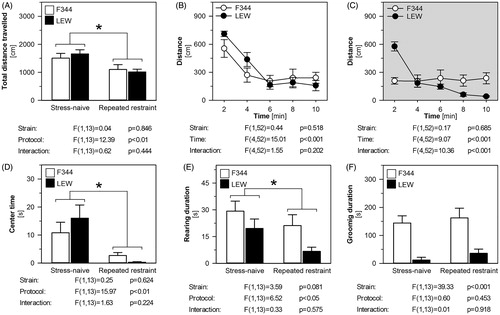
Figure 5. The behavior of F344 and LEW rats in the open field test before and after repeated restraint. The total distance traveled (A), the time-course of locomotor activity in the open field in stress-naïve (B) and repeatedly restrained (C) rats, time spent in the center (D), total time spent in rearing (E) and grooming (F) behavior. The results are expressed as group means ± SEM; n = 8 for F344 rats, n = 7 for LEW rats. The main effects of strain (LEW vs. F344 rats) and protocol (stress-naïve vs. repeated restraint) were tested by repeated measures two-way ANOVA and the results are listed below each graph. Bonferroni post hoc test was performed, *p < .05 stress-naïve versus repeated restraint group.