Figures & data
Table 1. Characteristics of participants.
Figure 1. Morning and midday activity of alpha-amylase in the group of youths with depression (n = 15) and the group of healthy youths (n = 15). Results are expressed as dot plots with each dot representing individual subject with mean ± SEM represented by horizontal lines. Statistical significance as revealed by repeated-measures GLM with subsequent Tukey pairwise comparisons: *p < .05, *p < .001.
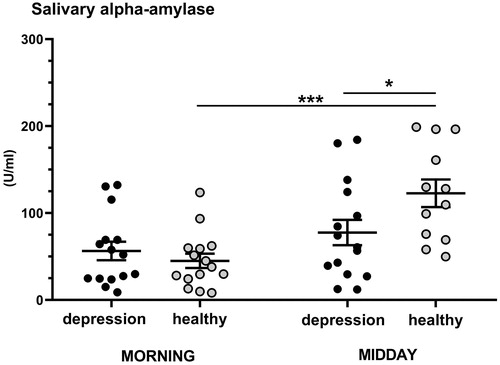
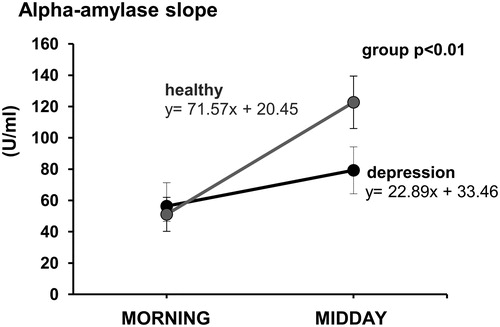
Figure 2. Morning to midday alpha-amylase slopes in the group of youths with depression (n = 15) and the group of healthy youths (n = 15). Slopes calculated from the line’s equations in the slope-intercept form are expressed as the values of angular coefficients m. Results are expressed as mean ± SEM. Statistical significance as revealed by t-test for independent groups.