Figures & data
Figure 1. (A) Repeated LPS administration reduced body weight gain. (B) LPS increased the relative weights of spleen and adrenals. Co-treatment with Dox prevented the effect of LPS on spleen, but not on the adrenals. Data are presented as Mean ± SEM. &p < 0.05 vs Sal, #p < 0.05 vs. corresponding group without LPS, *p < 0.05 vs. LPS.
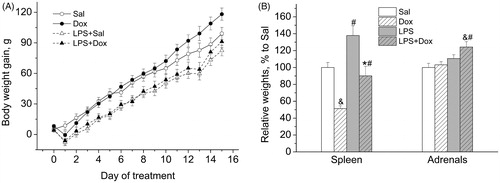
Figure 2. In the EPM test, repeated LPS administration decreased locomotor activity (number of rearing and distance traveled on the arms) and increased the number of defecation, indicating an increase in anxiety-like behavior. Data are presented as Mean ± SEM. &p < 0.05 vs Sal, *p < 0.05 vs. LPS.
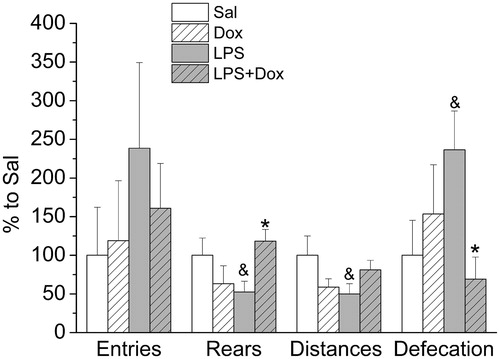
Figure 3. (A) Representative blots of proteins from amygdala and hypothalamus. (B) Iba-1 protein levels were significantly increased by LPS in 6 from 7 brain regions investigated as compared with saline. Dox alone did not influence Iba-1, but attenuated its increase induced by LPS in some brain regions. (C) Representative blots of proteins from the hypothalamus. (D) Compared with saline, Bcl-xL protein levels were significantly decreased after LPS in the hypothalamus and striatum. Dox alone did not influence Bcl-xL, but prevented LPS-induced decrease in Bcl-xL levels in both brain regions. Data are presented as Mean ± SEM. #p < 0.05 vs. corresponding group without LPS, *p < 0.05 vs. LPS. PFC: prefrontal cortex; HIPP: hippocampus; AMY: amygdala: HYPO: hypothalamus; STR: striatum; MID: midbrain; STEM: brainstem.
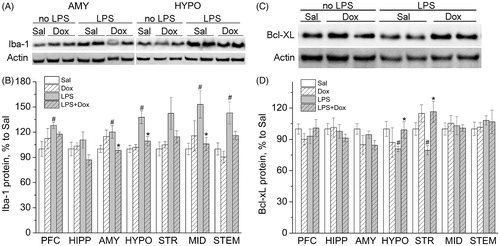
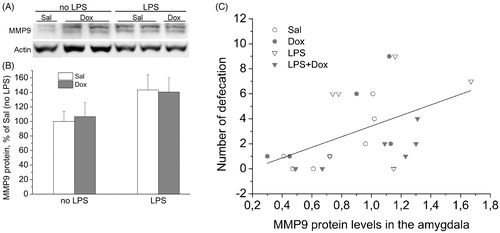
Figure 4. (A) Representative blot of MMP-9 in the protein samples of the amygdala. (B) Western blotting analysis of MMP-9 showed an increasing effect of LPS in the amygdala. Data are presented as Mean ± SEM. (C) Positive correlation (r = 0.497, p < 0.05) of the amygdala MMP-9 protein levels with the numbers of defecations in the EPM. Correlations between parameters for separate groups: Sal – r = 0.82, n = 6; Dox – r = 0.65, n = 6; LPS – r = 0.28, n = 8; LPS + Dox – r = 0.80, n = 6.