
Figures & data
Figure 1. Experimental design and results of behavioral tests. (A) The timeline of the experimental design used to induce PTSD-like symptoms in adult, male Long-Evans rats. The EPM was used to prescreen the animals for their innate anxiety-like behavior. Tail blood–plasma was taken to measure N-glycans for identification of possible pretrauma biomarkers of resilience or vulnerability to trauma. PTSD-like behavior was induced by footshocks. Twenty-one days later behavioral screening started: sociability (mobility, social interest, and social memory) and contextual fear (within and between section extinction). When the animals were sacrificed, trunk blood–plasma and brain samples were collected to measure the possible changes in N-glycans and plasma corticosterone and platelet serotonin levels. (B) z-scores of each groups. Traumatization of the animals (N = 50) resulted in the elevation of z-scores compared to the control group (N = 10) (two-sample t-test). Based on the z-scores, which were calculated from their overall PTSD-like behavior exhibited during the various behavioral tests, two subgroups (N = 10/group) were formed within the traumatized group: a resilient and a vulnerable, which also significantly differed from each other (one-way ANOVA with Fisher LSD posthoc). (C) Sociability and social discrimination tests 3 weeks after trauma. The consecutive columns of time spent in central compartment represent the consecutive 10 min of the tests (full: habituation; checkers: sociability; striped: social discrimination). The traumatized animals spent more time in the central compartment compared to the control during habituation (full column), while the vulnerable group spent more time in the central compartment compared to the control and resilient group during habituation (full column) and sociability (checkers column) (repeated-measures ANOVA with Fisher LSD post-hoc). (D) Sociability index based on the time spent sniffing an empty holder vs one containing a stimulus animal. Control, traumatized and resilient groups showed intact sociability index (that is, over random chance 50%), but not the vulnerable animals (single sample t-test). (E) Contextual fear 1 month after trauma. The minute-bin breakdown of the time spent with freezing on day 1 showed that the traumatized animals elicited more immobility at every given time point compared to the control, and at first it increased (2–6th min), then decreased (from 7th min) compared to previous time points (repeated-measures ANOVA with Fisher LSD post-hoc). (F) When visualizing resilient and vulnerable groups separately, there is a clear separation between them. The resilient group showed more freezing compared to the control only until the 7th minute, but did not differ after that. On the contrary, the vulnerable animals froze more throughout the 15 min compared to both control and resilient groups (repeated-measures ANOVA with Fisher LSD post-hoc). Data are expressed as average SEM. Empty squares represent individual values. EPM: elevated plus-maze; PTSD: posttraumatic stress disorder; C: control; T: traumatized; R: resilient; V: vulnerable. **p < 0.01 versus control; ==p < 0.01, =p < 0.05 versus resilient; $p < 0.05, $$p < 0.01 versus random 50%
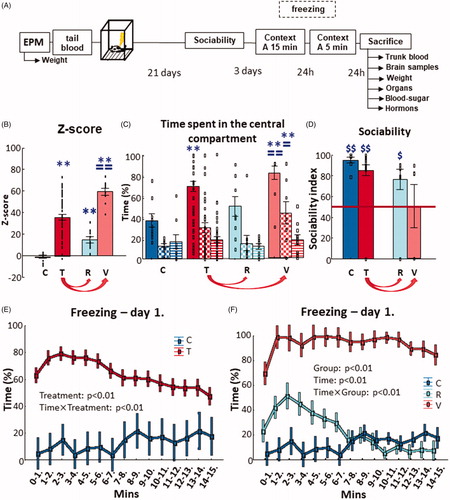
Figure 2. Results of blood-plasma N-glycan analysis. (A) The abundance of neutral complex N-glycans increased after trauma in both resilient and vulnerable groups compared to control animals. (B) Three groups of derived traits changed compared to their respective pretrauma abundances in the resilient and vulnerable, but not in the control groups. (C) One PGP changed after trauma specifically in the vulnerable group, while three other (D) were altered only in the resilient group. (E) Three PGPs changed similarly in a trauma specific manner (that is, similarly in both resilient and vulnerable groups). Individual data on (B, C, D, and E) are expressed as changes compared to their respective tail samples. (F) PGP26 showed a significant decrease compared to the control group after shock (individual data are expressed as change compared to the average of the control trunk/posttrauma samples). Note the different scales on the y-axes of the figures. All analysis was done with GLM and Bonferroni correction. Data are expressed as average SEM. Empty squares represent individual values. PGP: glycan peak in the blood–plasma. #p < 0.05, ##p < 0.01 versus pretrauma; **p < 0.01 versus control.
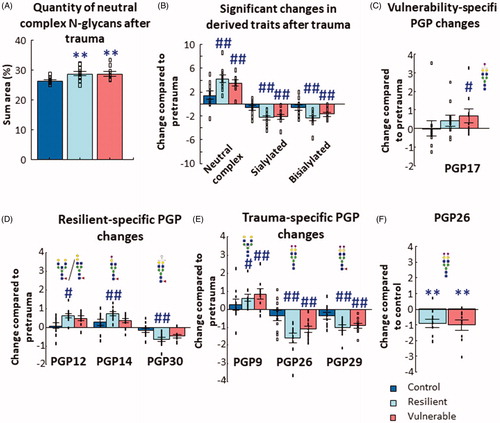
Figure 3. Coefficients of determination (r2) of all significant correlations. R2 values of (A) blood-plasma and (B: positive, C: negative) brain samples representing correlations between z-score and N-glycan levels. R2 values were multiplied by 100 to result in percentage (%) values. Red columns represent positive, while blue columns negative correlations. For peaks without structures we did not have enough knowledge to adequately propose one. PFC: prefrontal cortex; HC: hippocampus; PGP: glycan peak in the blood–plasma; BGP: glycan peak in the brain.
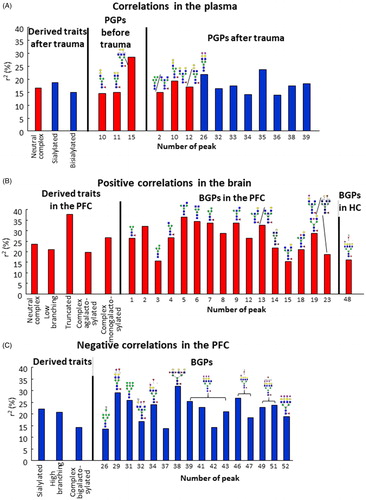
Figure 4. N-glycan quantity differences between the three brain areas. (A) Seven BGPs were different between the three studied brain regions. The color of the arrow represents which BGP differed, while the direction points to the brain region having a greater abundance of that peak. BGPs are in consecutive order: BGP9; BGP11; BGP13; BGP20; BGP22; BGP26; BGP29. Individual data are expressed as change compared to the average of all brain areas. (B) In all brain region, BGP11 showed an increase in the vulnerable group compared to the control. (C) Sialylated N-glycans were more abundant in the PFC compared to the hippocampus. Individual data are expressed as change compared to the average of all brain areas. The arrow indicates significant difference between PFC and HC. Individual data are expressed as change compared to the average of all the control brain samples at the three brain regions. All analysis was done with GLM and Bonferroni correction. Data are expressed as average ± SEM. Empty squares represent individual values. Note the different scales on the y-axes of the figures. BGP: glycan peak in the brain; PFC: prefrontal cortex; HC: hippocampus; Amy: amygdala. **p < 0.01 versus control.
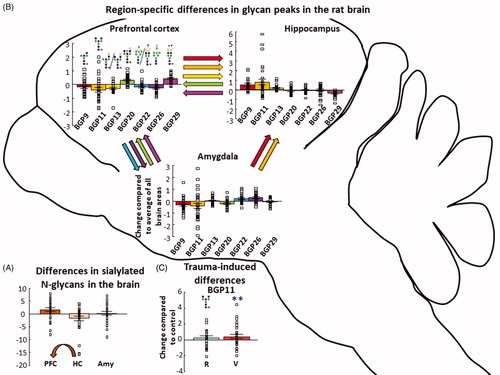
Figure 5. T-SNE and ROC curve analyzis of N-glycan results. (A) N-glycan posttrauma blood samples separated based on the treatment. Traumatized animals (resilient and vulnerable samples) formed a separate cluster from the control group, indicating that trauma induces specific changes in the N-glycome of the blood. (B) In the samples of the PFC, vulnerable animals show a trend for separating from the intermixing control and resilient groups. This shows subtle changes in the N-glycolysation pattern in the PFC of the vulnerable animals. (C) Separation of brain samples from the control (untraumatized) group based on the examined brain areas. There was a clear PFC cluster compared to the intermixed HC and Amy samples, showing that PFC have a unique N-glycosylation pattern compared to the other two brain area. (D) Average relative area SEM of PGP15 in pretrauma blood samples. Red dashed line is the cutoff value for PGP15 area (i.e. >1.285%) which gives the best tradeoff between sensitivity and specificity. The proportion of PGP15 is expressed as a percentage of the total integrated area of the chromatogram. Empty squares represent individual values. (E) ROC curve analysis of PGP15(FA3G2). With the highest area under the ROC curve (0.8 with standard error of 0.102; 95% confidence interval: 0.599–1.000; p = 0.02), PGP15(FA3G2) was classified as a candidate biomarker in a rat model of PTSD with a “good” discriminative ability. Note the different scales on the y-axes of the figures. T-SNE: t-Distributed Stochastic Neighbor Embedding; PFC: prefrontal cortex; HC: hippocampus; Amy: amygdala; ROC: receiver operating characteristic; PGP: glycan peak in the blood-plasma; PTSD: posttraumatic stress disorder; C: control; R: resilient; V: vulnerable.
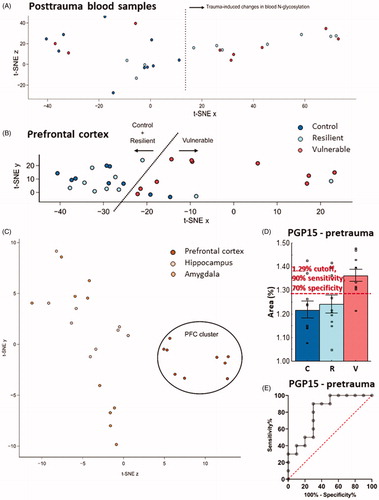
Table 1. Summary of the main results