Figures & data
Figure 1. (A) Experimental procedure and timeline. (B) Trial timing for the decision-making task.
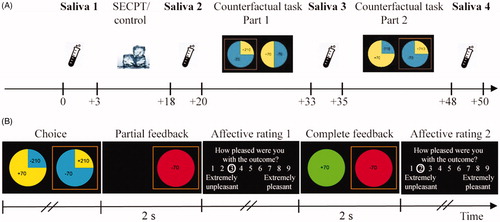
Figure 2. Decision-making model notation.
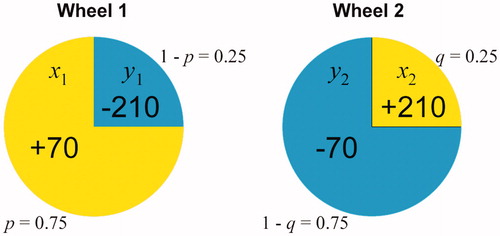
Table 1. Characteristics of Stress and Control Groups. Individual cells depict means ± standard deviation of the mean.
Figure 3. The SECPT procedure increased self-perceived stress (A) and self-reported pain (B) but had no effect on self-reported anger (C). Error bars represent standard error of means.
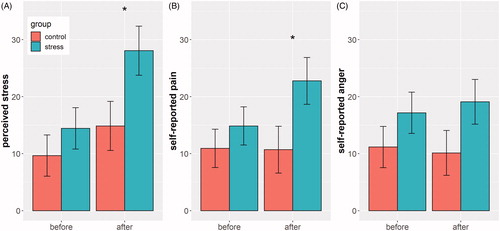
Figure 4. (A) The average salivary cortisol levels for the stress and control group at T0 (immediately before the procedure), T1 (15 min), T2 (30 min) and T3 (45 min). Error bars represent standard error of means. (B) Compared to the control group, the stress group showed greater AUC. Each point within a violin plot represents mean of AUC within each group, the shape represents data distribution. ***refers to p <.001.
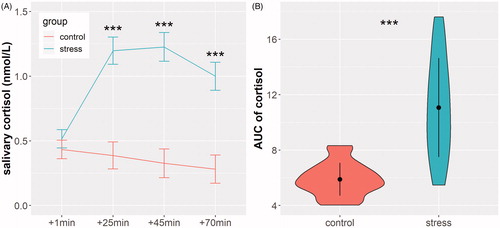
Figure 5. Affective ratings for partial and complete feedback. The left panels show the effect of obtained outcome (A) and chance counterfactual (B) affect rating following partial feedback. The right panels depict the effect of obtained outcome (C) and agent counterfactual (D) on affect rating following complete feedback. All the predictors are z-transformed. Shading around lines represent 95% CI for point estimates.
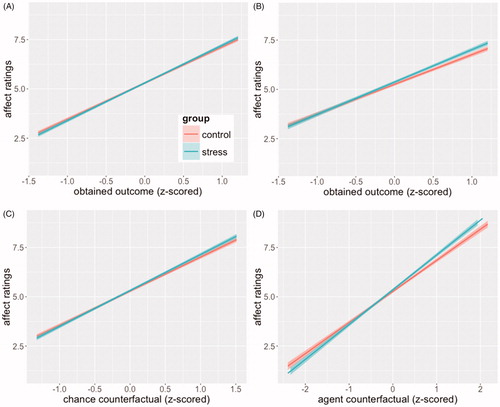
Table 2. Model of choice behavior using binary logistic regression.
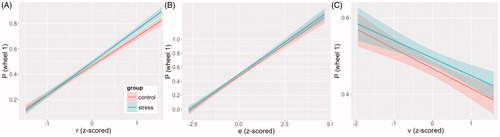
Figure 6. Behavioral sensitivity to regret, expected value, and risk variance. Panels illustrate the logit model-predicted probability of choosing wheel 1 at varying levels of anticipated regret (A), expected value (B) and risk variance (C). All the predictors are z-transformed. Shading around lines represent 95% CI for point estimates.