Figures & data
Figure 1. Distribution of PACAP and PAC1 mRNA expression in infralimbic (IL) neurons using RNAscope. (A) Cellular labeling of PACAP (upper arrow) and PAC1 (lower arrows) is largely distinct, with occasional cells showing colocalization (upper arrow). (B) A large population of projection neurons expresses PACAP (arrows). (C) PAC1 is expressed in both vGluT1-positive (upper left arrow) and vGluT1 negative (lower left arrow) neurons. A sizable population of vGluT1 neurons are PAC1 negative (right arrows). (D) GABAergic (GAD67) interneurons can express mostly PACAP (upper left inset) or PAC1 (lower left inset) alone or coexpress PACAP and PAC1 (lower right arrow). (E). While astrocyte processes (GFAP) are in proximity to both PACAP (third from bottom) and PAC1 ( white upper arrows)-containing cells, there is no evidence for colocalization in GFAP-positive cell bodies (lower arrows). (F) Preferential expression of PACAP vs. PAC1 mRNA in glutamatergic (vGluT1 positive) neurons in the IL, assessed by particle counts in vGlutT1 mRNA expressing neurons as defined from underlying nuclear stain (DAPI). (G) Preferential expression of PAC1 vs. PACAP mRNA in GABAergic IL neurons (GAD67 immunopositive). Note undetectable expression of PACAP in the majority of GAD67 neurons. (H) PACAP/PAC1 expression ratio in vGlut1 neurons relative to GAD67 highlights differential expression patterns across cell populations Data as Mean ± SEM. **p < 0.005, ***p < 0.0001.
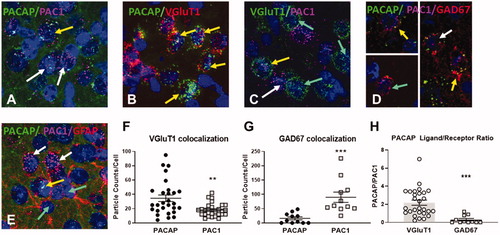
Figure 2. Anatomical verification of cannulas implantation into the infralimbic cortex (IL).
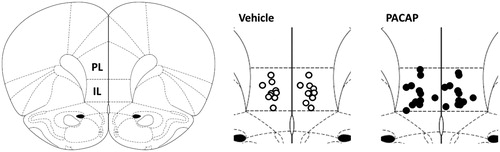
Figure 3. Behavioral and HPA axis responses to forced swim test after PACAP or vehicle infusions into the IL (A–D). While overall immobility was not affected by PACAP (A), active behaviors such as swimming (B), climbing (C), and diving (D) were affected in PACAP treated animals. Blood samples were taken following completion of the FST for ACTH and CORT determinations. ACTH was significantly increased in PACAP-treated animals relative to controls at early post-FST time points, whereas corticosterone secretion was slightly increased only at the first post-stress time point and the overall corticosterone response was not affected. Data as Mean ± SEM. *p < 0.05.
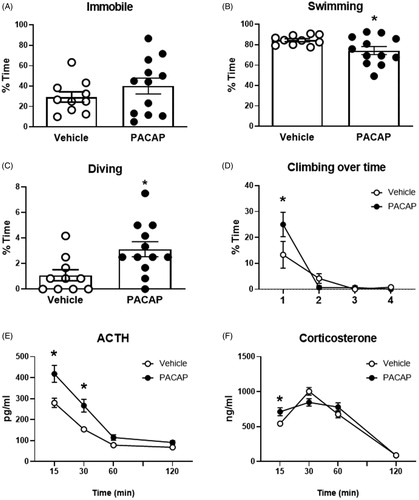
Figure 4. Passive avoidance behavior tested 5 days after FST exposure in PACAP and vehicle pretreated animals. (A) PACAP-treated rats were quicker to cross over to the dark chamber of the apparatus on the habituation trial. (B) Prior PACAP exposure did not affect cross-over latency on the training trial, nor during testing phase, but significantly enhanced retention of avoidance behavior when tested 2 weeks later (C), suggestive of enhanced memory of the aversive experience. Note that mechanical issues with the apparatus resulted in exclusion of data from three animals (2 vehicle, 1 PACAP). Data as Mean ± SEM. *p < 0.05.
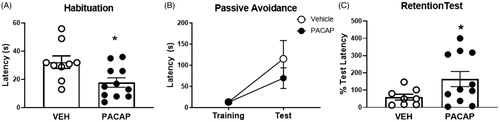
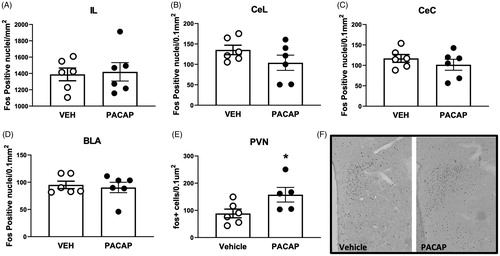
Figure 5. Expression of Fos following acute infusion of PACAP into the IL of unstressed rats. PACAP infusion increased the number of PVN Fos immunoreactive neurons after IL infusion, but did not affect overall expression in the IL or downstream targeted in the central and lateral divisions of the central amygdaloid nucleus and the basolateral amygdala. Data as Mean ± SEM. *p < 0.05.