
Figures & data
Table 1. Summary of previous findings about the associations of fingernail cortisol with saliva or hair cortisol.
Table 2. Participants’ demographic data.
Figure 1. Scatter plots illustrating the relationship between the cortisol levels in the 1-cm hair segment and the cortisol levels in fingernail samples collected 3 months later.
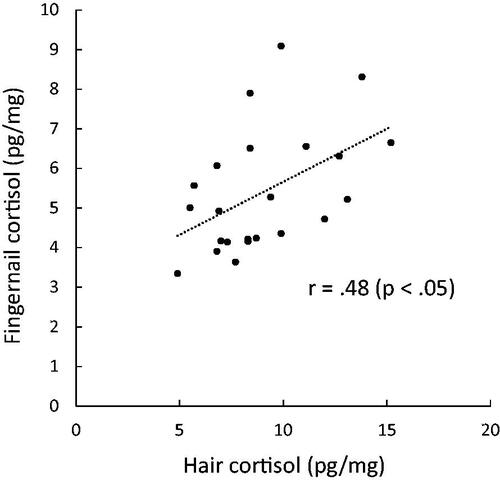
Table 3. Correlations between hair cortisol levels and fingernail cortisol levels over 8 monthsTable Footnotea.
Figure 2. Scatter plots illustrating the relationship between the 30-day integrated area under the curve based on salivary cortisol levels at awakening and bedtime (AUCt1&3) and the cortisol levels in fingernail samples collected 2 months (A) and 5 months (B) later.
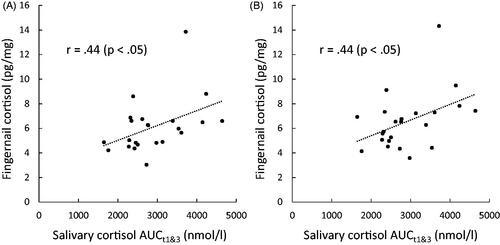
Table 4. Correlations between salivary cortisol levels (AUCt123) and fingernail cortisol levels over 8 monthsTable Footnotea,Table Footnoteb.
Table 5. Correlations between baseline salivary cortisol levels (AUCt1&3) and fingernail cortisol levels over 8 monthsTable Footnotea,Table Footnoteb.
Table 6. Intercorrelations between fingernail cortisol across 8 months.