Figures & data
Figure 1. Specificity of the CRHR1 antiserum using Western blot analysis. A1, B1: The antiserum shows a single band around 49 kDa, as determined by molecular weight markers (colored lanes), in extracts from the NHpC. The antibody at 1:5,000 dilution was pre-absorbed with 5 µg (lane A1) or 2.5 µg (lane B1) of immunogenic peptide prior to application in a Western blot. The density of the band was increased as the concentration of peptide decreased. GAPDH was the reference protein.
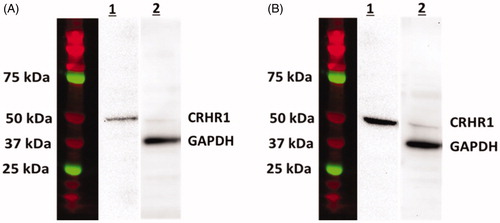
Figure 2. Changes in plasma corticosterone concentration in response to different times of immobilization stress. The values are shown as mean ± SEM. Significant differences (p < 0.05) among the treatment groups were indicated by different letters above each time point.
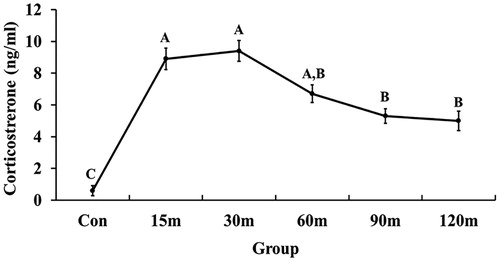
Figure 3. Effects of immobilization stress on relative mRNA expression levels of CRH (A), CRHR1 (B), and CRHR2 (C), in the NHpC and CRH (D), CRHR1 (E), and CRHR2 (F) in the PVN. Fold changes of relative expression levels were found using 2−ΔΔCt method after normalization with internal controls (GAPDH or β-actin). Means ± SEM were determined for each gene. Significant differences (p < 0.05) among groups were specified by different letters above each bar or histogram.
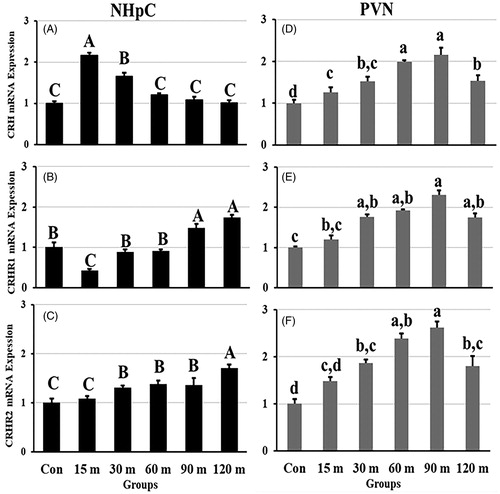
Figure 4. Fold changes in the relative gene expression of AVT (A) and its major receptor, V1aR (C), in the NHpC, and AVT (B) and V1aR (D) in the PVN during immobilization stress were found using 2−ΔΔCt method after normalization with GAPDH or β-actin. Means ± SEM were determined for each gene. Significant differences (p < 0.05) among groups were specified by different letters above each bar.
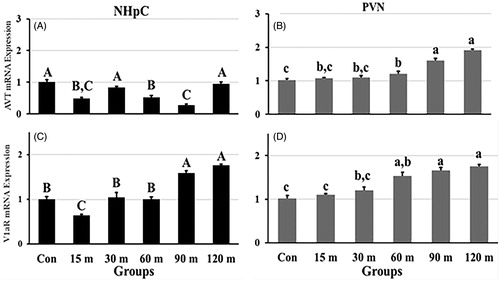
Figure 5. Effects of immobilization stress on the relative gene expression of (A) BDNF and (C) GR in the NHpC, and (B) BDNF and (D) GR in the PVN. The 2−ΔΔCt method was used to find fold changes of relative expression levels after normalization with GAPDH or β-actin. Means ± SEM were determined for each gene. Significant differences (p < 0.05) among groups were specified by different letters above each bar.
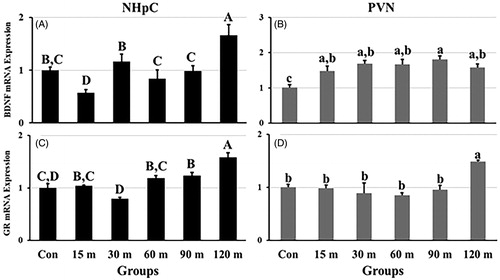
Figure 6. Fold Changes of POMC transcripts (hn and mRNA) in the APit during immobilization stress were performed using the 2−ΔΔCt method after normalization with GAPDH or β-actin. Means ± SEM were determined for each gene. Significant differences (p < 0.05) among groups were specified by different letters above each bar.
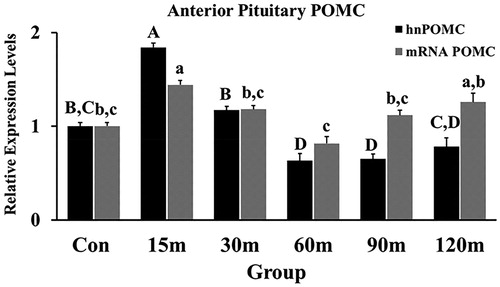
Figure 7. Immobilization stress effects on mRNA expression levels of CRHR1 and CRHR2 (A), V1aR and V1bR (B), and GR (C) in the APit. After normalization with GAPDH or β-actin using the 2−ΔΔCt method, fold changes of relative gene expression levels were shown. Means ± SEM were determined for each gene. Significant differences (p < 0.05) among groups were specified by different letters above each bar.
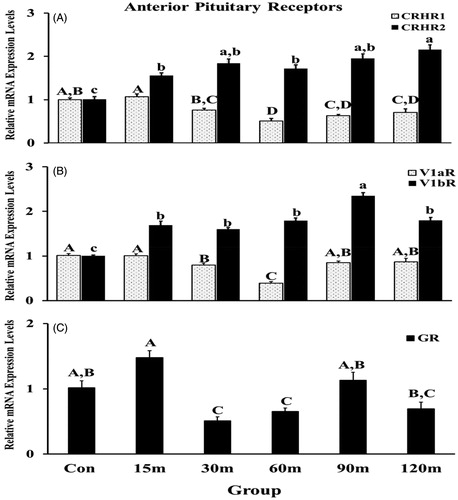
Figure 8. CRHR1 and GR detection and quantification using Western blot in the NHpC (A) and PVN (B) during immobilization stress (Control-120m). The density of bands was quantified using the alpha view SA program. Mean ± SEM changes in protein quantity between stressed birds compared to controls were determined. Significant differences (p < 0.05) among groups were specified by different letters above each bar.
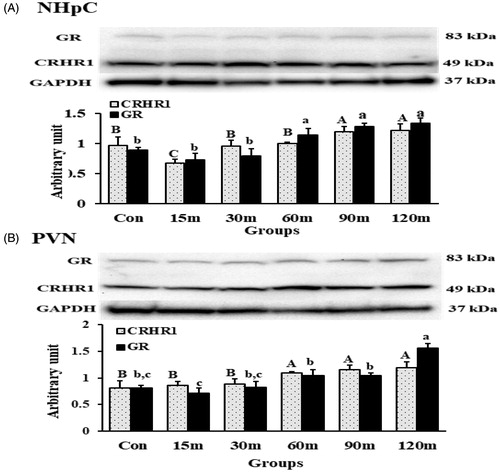
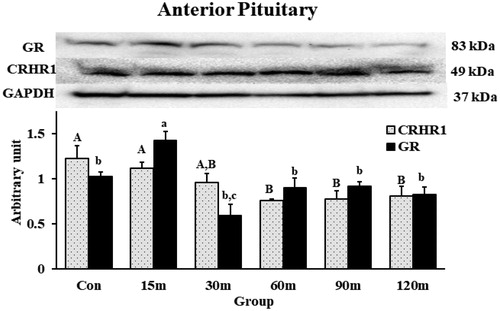
Figure 9. Western blot quantification of CRHR1 and GR in the APit during immobilization stress (Control-120m). The density of bands was analyzed using alpha view SA program. Mean ± SEM changes in protein quantity between stressed birds compared to controls were determined. Significant differences (p < 0.05) among groups were specified by different letters above each bar.