Figures & data
Figure 1. Experimental Timeline. In the first experiment, groups were given three moderate shock stress sessions with interpolated days of rest (I) or on consecutive days with no rest (N). Following each day of moderate shock stress, groups were given access to water (W) or glucose (G). In the second experiment, all groups received two severe shock stress sessions. Groups either received water following both stressors (WW), glucose following both stressors (GG), water following the first stressor and glucose the second (WG), or glucose following the first stressor and water the second (GW). S: 100 shock stressor, s: 25 shock stressor, T: shuttle-box testing, w: water was given after stress, g: Glucose was given after stress.
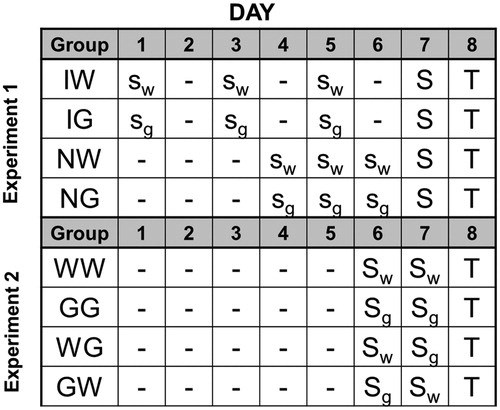
Figure 2. Percent freezing (left panel) and shuttle escape latencies (right panel) for 4 groups in Experiment 1. All groups received hormetic training in the form of 3, 30 min sessions of 25 inescapable tailshocks (1 session per day) prior to severe stress exposure. Group IW and Group IG received 100 mL of water or glucose, respectively, following each hormetic session with interpolated days of rest. Group NW and Group NG received 100 mL of water or glucose, respectively, after each hormetic session with no days of rest. Shuttle-escape testing occurred 24 h later. Freezing was measured over 5 trials (FR-1) at the start of the shuttle-escape test. Impaired escape performance was assessed over the next 25 trials (FR-2). Error bars denote mean ± SEM. * denotes p < 0.05 using Bonferroni post hoc comparisons of simple main effects of groups compared to NW.
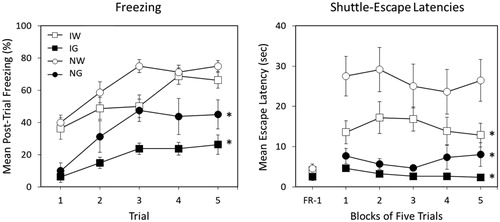
Figure 3. Post-stress fluid consumption for 4 groups in Experiment 2. All groups were exposed to two severe stress sessions 24 h apart. Two groups received either 100 mL of water or 100 mL of a concentrated 40% (wt/vol) glucose solution following both stress sessions (Group WW and GG, respectively). One group received water following the first stress session and glucose following the second stress session (Group WG). The remaining group received glucose following the first stress session and water following the second session (Group GW). Total volume of fluid consumed was measured in milliliters (mL). Error bars denote mean ± SEM. * denotes p < 0.05 using Bonferroni post hoc comparisons of simple main effects of groups compared to WW.
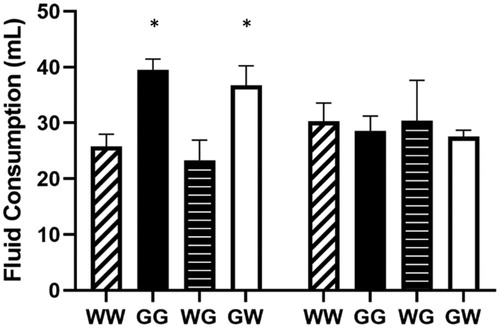
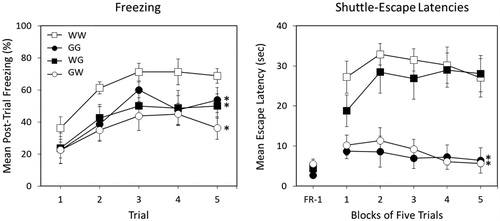
Figure 4. Percent freezing (left panel) and shuttle escape latencies (right panel) for 4 groups in Experiment 2. All groups were exposed to two severe stress sessions 24 h apart. Two groups received either 100 mL of water or 100 mL of a concentrated 40% (wt/vol) glucose solution following both stress sessions (Group WW and GG, respectively). One group received water following the first stress session and glucose following the second stress session (Group WG). The remaining group received glucose following the first stress session and water following the second session (Group GW). Shuttle-escape testing occurred 24 h later. Freezing was measured over 5 trials (FR-1) at the start of the shuttle-escape test. Impaired escape performance was assessed over the next 25 trials (FR-2). Error bars denote mean ± SEM. * denotes p < 0.05 using Bonferroni post hoc comparisons of simple main effects of groups compared to WW.