
Figures & data
Figure 1. Individuals’ COVID-19 related fears as a function of their pre-pandemic Tonic SCL scores. A scatter plot of pre-pandemic Tonic SCL in microsiemens and COVID-related fears with a linear regression line and its corresponding 95% confidence interval. On the margins we display density plots of each of the plotted variables.
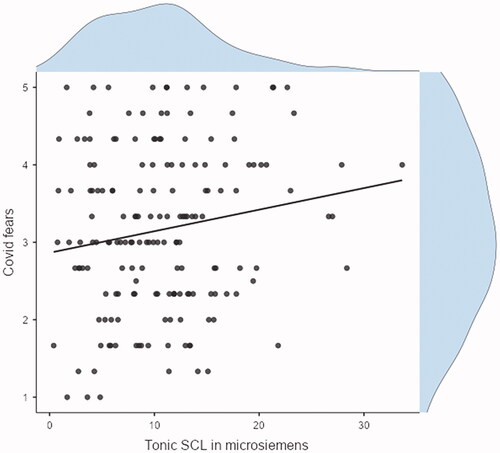
Figure 2. Individuals’ COVID-19 related fears as a function of their pre-pandemic NS-SCRs score. A scatter plot of pre-pandemic NS-SCRs and COVID-related fears with a linear regression line and its corresponding 95% confidence interval. On the margins we display density plots of each of the plotted variables.
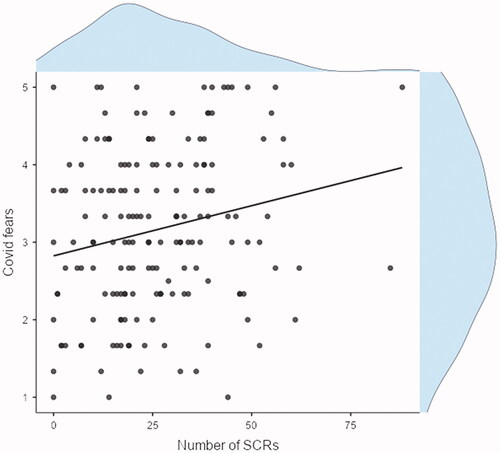
Table 1. Correlation matrix for the three specific fears comprising our COVID-19 fear score and pre-pandemic tonic SCL and number of SCRs.
Table 2. Means and SD’s of the main variables and correlations between them.
Table 3. Hierarchical regression analysis predicting COVID-19 related fears with NS-SCRs as a predictor.
Figure 3. Effects of pre-pandemic number of NS-SCRs on COVID-related fears among individuals who inhabited with a low, average, and high number of people in their household during the lockdown. A simple slope plot depicting the relationship between standardized pre-pandemic number of NS-SCRs and COVID fears in three subgroups in the sample – those reporting a low (-1SD; two people), an average (four people), and a high (+1SD; six people) number of people in their household during the lockdown.
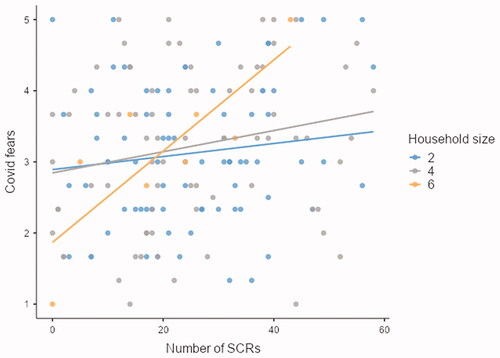
Table 4. Moderation analysis of the interaction between number of NS-SCRs and household size on covid-19 fears.
Table 5. Hierarchical regression analysis predicting COVID-19 related fears with tonic SCL, in microsiemens, as a predictor.