
Figures & data
Figure 1. Experimental design. Women undergoing vaginal delivery (n = 35) or cesarean delivery (n = 56) accepted to participate to the current study. In the birth clinic, all parturitions took place between 08:30–11:00 h. Women provided saliva samples for cortisol measurement and had a 5-min electrocardiogram recording for HRV (heart rate variability) assessment before and after delivery (6 h after the first sampling).
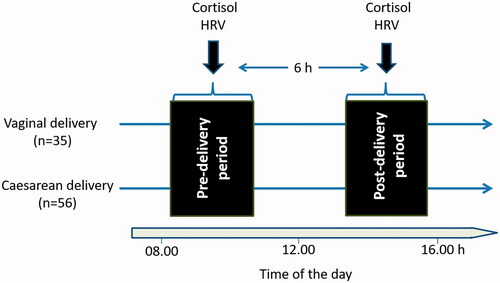
Table 1. Demographic and obstetrical variables of the participants (n = 91).
Figure 2. Cortisol levels (mean ± SD) were higher in the women having vaginal delivery than that of the women having cesarean delivery (*p = 0.022). However, there were no differences between the cortisol levels measured before and after delivery (p > 0.05).
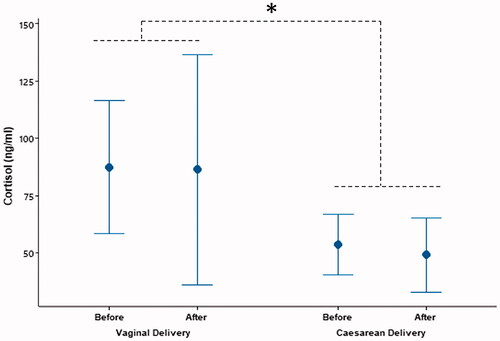
Table 2. Salivary cortisol and HRV parameters in vaginal and cesarean delivery before and after birth (mean ± SD).