Figures & data
Table 1. Means, standard deviations, and correlations between all study variables in study 1 (n = 277).
Figure 1. Mediation model in study 1. bothersome and predictable as Mediators between degree of PMS and perceived ANS responses. Depicted are beta coefficients for the relevant paths (p < 0.05).
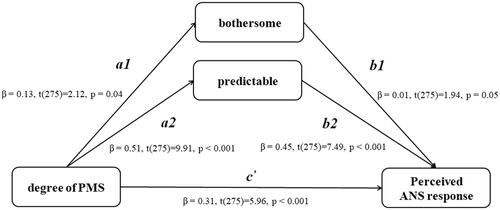
Figure 2. Experimental process in study 2. Tasks 1 and 2 are randomly assigned speaking and mental arithmetic task. Rec = Recovery period.
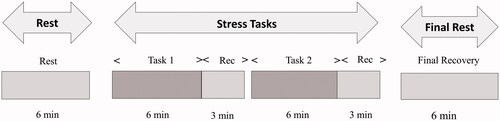
Table 2. Descriptive statistics in study 2 (M ± SD).
Figure 3. ΔHR and ΔLF/HF reactivity and recovery among two groups in the speaking task. During the task stage, ΔHR and Δ LF/HF were the difference between data in the task period and data in the baseline period; During the recovery stage, ΔHR and Δ LF/HF were the difference between data in the recovery period and data in the task period. Error bars depict standard error of the mean. *p < 0.05.
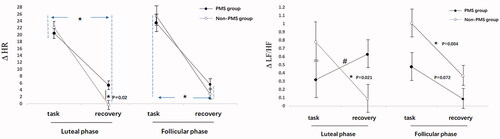
Table 3. HR and HRV (lg(ms2)) in the two tasks (M ± SD).
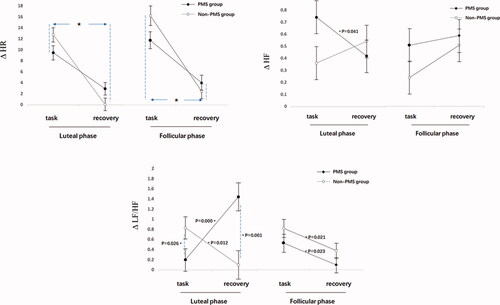
Figure 4. ΔHR, ΔHF and ΔLF/HF reactivity and recovery among two groups in the mental arithmetic task. During the task stage, ΔHR, ΔHF and Δ LF/HF were the difference between data in the task period and data in the baseline period; During the recovery stage, ΔHR, ΔHF and Δ LF/HF were the difference between data in the recovery period and data in the task period. Error bars depict standard error of the mean. *p < 0.05.