
Figures & data
Figure 1. Mice spent half a day physically contacting each other. (A) A raster plot showing the physical interactions of pair-housed mice over 24 h. (B) The total time for specific interactions between two mice in the dark phase (Kruskal–Wallis followed by Dunn’s test, p values were determined by comparison to both moving-no contact). (C) The total time for specific interactions between two mice in the light phase (Kruskal–Wallis followed by Dunn’s test, p values were determined by comparison to no moving-contact). (D) The percentage of time for specific interactions between two mice in 24 hours. *p < 0.05, **p < 0.01, ***p < 0.001; n = 3 pairs; mean ± S.E.M.
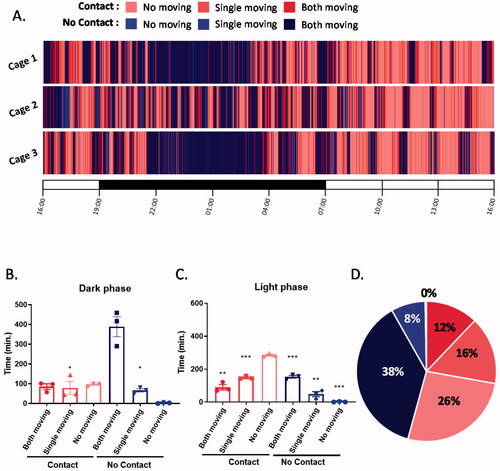
Figure 2. Three different housing conditions and the experimental schedule. (A) Male mice were housed in three different conditions: pair-, split-, and single-housing conditions. (B) Schematic diagram of the experimental schedule.
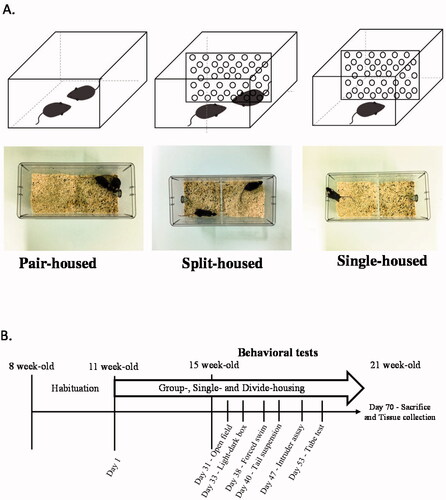
Figure 3. Mice housed in divided cages showed increased anxiety-like behavior. (A) Representative traces of mice in the open field. (B) Travel distances in the open-field test. (C) Time spent in the inner zone in the open-field test. (D) Time spent in the light zone during the light-dark box test. (E) The number of transitions between the light and dark zones. Welch's ANOVA followed by Dunn’s test; *p < 0.05, **p < 0.01, ***p < 0.001; n = 12–14 per group; mean ± S.E.M.
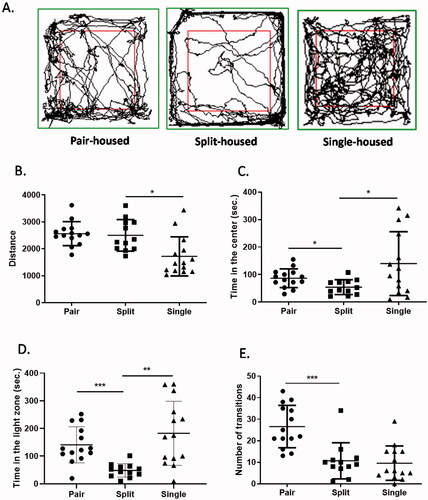
Figure 4. Depression-like behavior was similar among mice housed in different conditions. (A) Latency to the first bout of immobility in the forced swim test. (B) The total immobility time in the forced swim test. (C) Latency to the first bout of immobility in the tail suspension test. (D) The total immobility time in the tail suspension test. Welch's ANOVA followed by Dunn’s test; n = 12–14 per group; mean ± S.E.M.
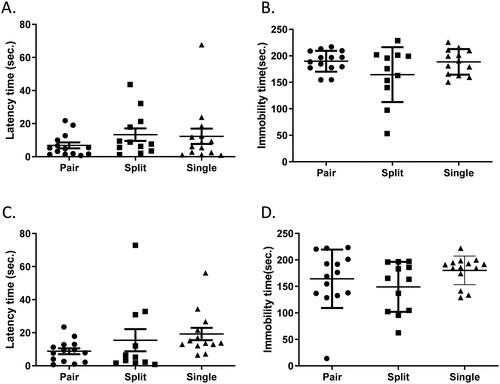
Figure 5. Mice housed in divided cages showed changes in social behaviors. (A) Social dominance evaluated by pairwise comparisons in the tube test (Wilcoxon signed-rank test, n = 10–12 pairs). (B) The total duration of social interaction in the intruder assay. (C) The latency to physical interaction in the intruder assay. Welch's ANOVA followed by Dunn’s test; *p < 0.05, **p < 0.01; n = 12–14 per group; mean ± S.E.M.

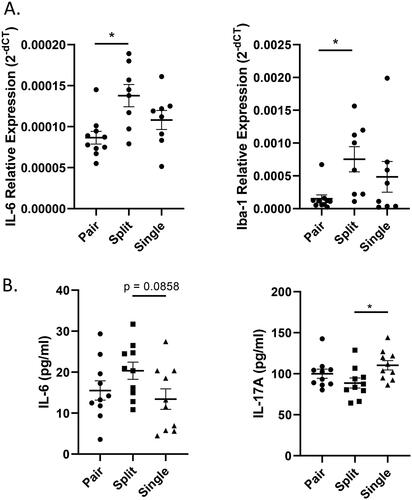
Figure 6. Expression of the cytokine IL-6 was increased in split-housed mice. (A) Expression levels of the cytokines IL-6 and Iba-1 in the hippocampus (n = 8–10 per group). (B) Serum concentrations of the cytokines IL-6 and IL-17A. (n = 10 per group). Welch's ANOVA followed by Dunn’s test; *p < 0.05; Mean ± S.E.M.
Supplemental Material
Download MP4 Video (55.5 MB)Data availability statement
All data generated or analyzed during this study are included in this published article and its supplementary information files.