Figures & data
Figure 1. Detection and comparison of the abdominal withdrawal reflex (AWR) induced by graded colorectal distention (CRD). *p < 0.05, the SPS-only group at each time point compared with the control group, and the SPS + EphrinB1-Fc group at each time point compared with the control + EphrinB1-Fc group. ★p < 0.05, comparison among the three groups on day 1, day 7, and day 14 in the SPS-only group and SPS + EphrinB1-Fc group, respectively. ▲p < 0.05, comparison between the SPS-only group and the SPS + EphrinB1-Fc group at each time point. Ten rats/group. The data are presented as the mean ± SEM.
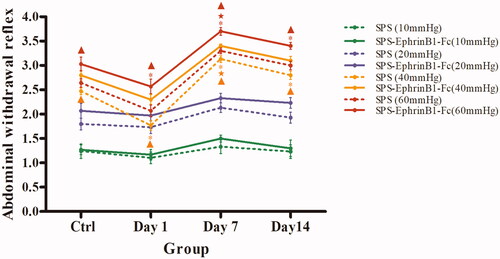
Figure 2. Immunohistochemical exploration of EphB2 in the spinal dorsal horn. Panels (A–D) show EphB2+ cells in the dorsal horn of the lumbar cord of the control group (A), Day 1 group (B), Day 7 group (C), and Day 14 group (D) in SPS. Panels (E–H) correspond to the SPS + EphrinB1-Fc of the control group (E), Day 1 group (F), Day 7 group (G), and Day 14 group (H). “Ctrl” corresponds to the control, and Day 1, Day 7, and Day 14 correspond to days 1, 7, 14 after SPS, respectively. All images are at the same magnification, scale bar = 100 μm. Black arrows indicate positive cells.
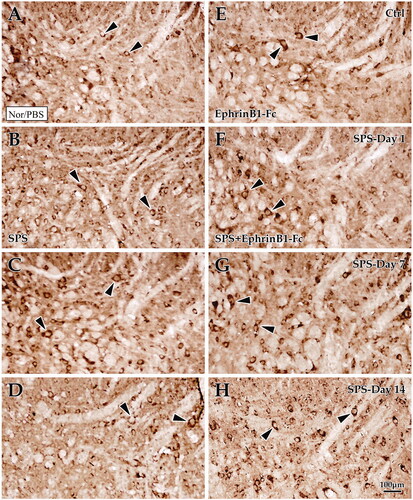
Figure 3. Enumeration and comparison data for EphB2+ and C-Fos + cells. Histograms (A) and (B) showing the comparison results of the numbers of EphB2+ cells and the coexistence rates of NeuN-EphB2 in the different groups; differences were observed among them, especially in the Day 7 group. Histogram (C) showing the comparison result of the numbers of C-Fos + cells; the Day 7 group had the most remarkable changes, and they were more obvious in the SPS + EphrinB1-Fc treatment group than in the SPS-only groups. The histogram (D) (double labeling data for NeuN-C-Fos) showed that the change trend was basically consistent with the results of single-label immunohistochemistry. *p < 0.05, ★p < 0.05, ▲p < 0.05 as same as . Five rats/group. The data are presented as the mean ± SEM.
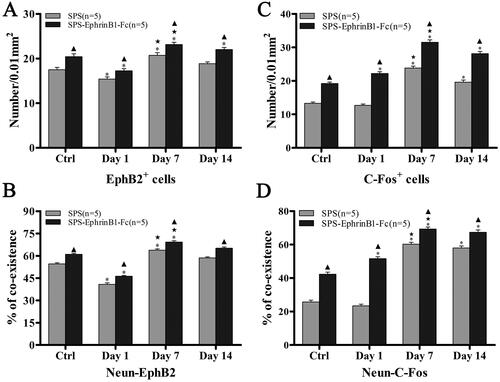
Figure 4. Immunofluorescence double-labeling experiment for NeuN and EphB2. The image shows the immunofluorescence double markers (yellow) of NeuN (red) and EphB2 (green). Panels A-H show the SPS and SPS + EpheinB1-Fc groups, respectively. Panels (A–D) show EphB2+ and NeuN + cells in the dorsal horn of the lumbar cord of the control group (A), Day 1 group (B), Day 7 group (C), and Day 14 group (D) in SPS. Panels (E–H) correspond to the SPS + EphrinB1-Fc of the control group (E), Day 1 group (F), Day 7 group (G), and Day 14 group (H). The abbreviations in this figure are the same as those in , and all the images are at the same magnification; scale bar = 100 μm. White arrows indicate double-labeled cells.
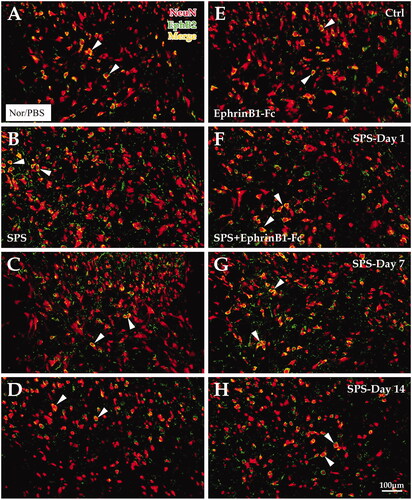
Figure 5. Detection and comparison of the protein and mRNA levels of EphB2 and C-Fos. Panels (A,B) show that the EphB2 and C-Fos protein levels were reduced in the day 1 group but increased in the day 7 group compared with their control groups, respectively. With the administration of EphrinB1-Fc, their protein levels were distinctly upregulated. Histograms (C) and (D) showing the comparison of the EphB2 and C-Fos mRNA levels in the different groups, respectively; the statistical results showed that the EphB2 and C-Fos mRNA levels were upregulated by SPS induction and increased further with EphrinB1-Fc treatment. *p < 0.05, ★p < 0.05, ▲p < 0.05 as described for . Five rats/group. The data are presented as the mean ± SEM.
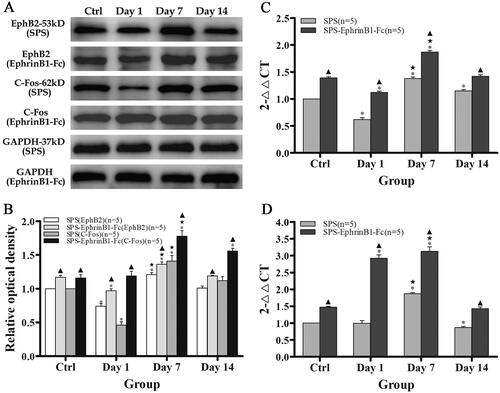
Figure 6. Immunohistochemical exploration of C-Fos in the spinal dorsal horn. Panels (A–D) show C-Fos + cells in the dorsal horn of the lumbar cord of the control group (A), Day 1 group (B), Day 7 group (C), and Day 14 group (D) in SPS. Panels (E–H) correspond to the SPS + EphrinB1-Fc of the control group (E), Day 1 group (F), Day 7 group (G), and Day 14 group (H). “Ctrl” corresponds to the control, and Day 1, Day 7, and Day 14 correspond to days 1, 7, 14 after SPS, respectively. All images are at the same magnification, scale bar = 100 μm. Black arrows indicate positive cells.
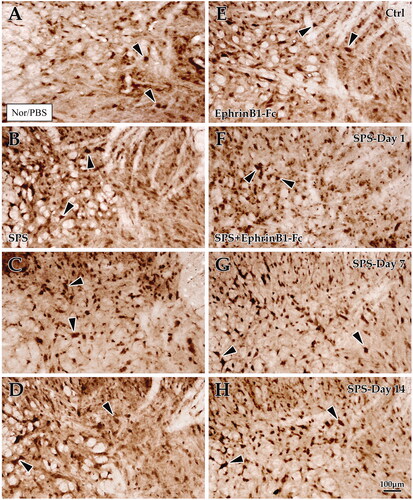
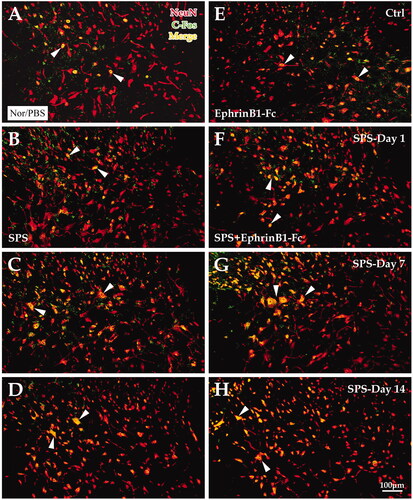
Figure 7. Immunofluorescence double-labeling experiment for NeuN and C-Fos. The image shows the immunofluorescence double markers (yellow) of NeuN (red) and C-Fos (green). Panels A-H show the SPS and SPS + EpheinB1-Fc groups, respectively. Panels (A–D) show C-Fos + and NeuN + cells in the dorsal horn of the lumbar cord of the control group (A), Day 1 group (B), Day 7 group (C), and Day 14 group (D) in SPS. Panels (E–H) correspond to the SPS + EphrinB1-Fc of the control group (E), Day 1 group (F), Day 7 group (G), and Day 14 group (H). All the images are at the same magnification; scale bar = 100 μm. White arrows indicate double-labeled cells.