
Figures & data
Figure 1. Flow diagram for selection of studies.
A flow diagram indicating the process of identification, screening, and selection of studies in this review and the final number of included studies.
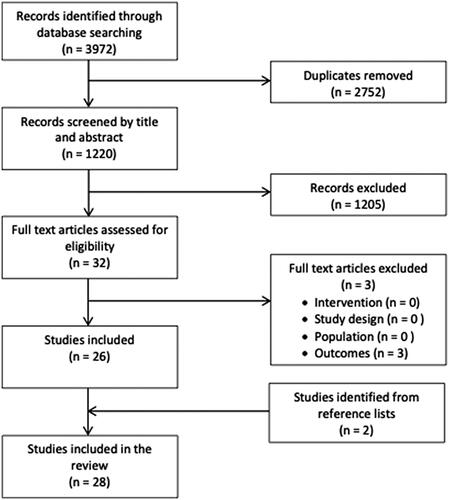
Table 1. Summary of included studies (n = 28).