Figures & data
Table 1. Descriptives of the study participants and excluded individuals.
Table 2. Mean raw and relative brain volumes.
Figure 1. Example of the segmentation of amygdala and hippocampus in a study subject. The amygdala and hippocampus are shown in coronal, axial, and sagittal planes with orange and blue colors respectively.
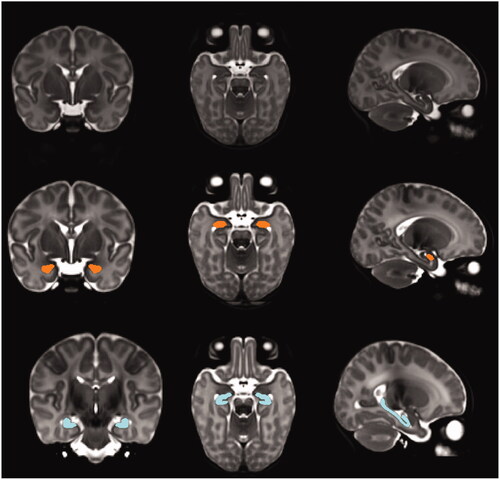
Table 3. Correlations between the study variables and their p values.
Table 4. Associations between Pregnancy-related anxiety Questionnaire scores at GW24 and newborn amygdalar and hippocampal volumes.
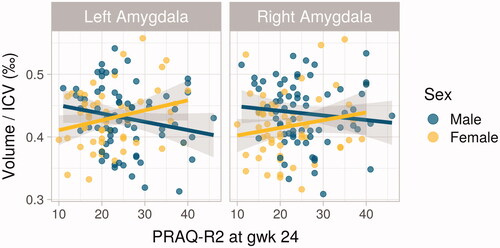
Figure 2. Scatter plots of the associations between Pregnancy-Related Anxiety Questionnaire Revised 2 (PRAQ-R2) at GW24 and newborn amygdalar volumes in males and females. The significant association between PRAQ-R2 and female left amygdalar volume (p = .039) is on the left.