
Figures & data
Figure 1. Study design; CES-D: The Center for Epidemiologic Studies Depression Scale; STAIX-1: The State-Trait Anxiety Inventory; BD: Body Dissatisfaction; PANAS: The Positive and Negative Affect Schedule; PSS: The Perceived Stress Scale.
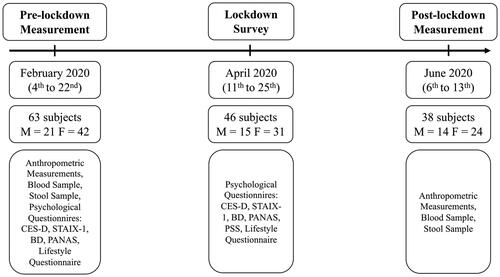
Table 1. Lifestyle changes (n = 46).
Table 2. Psychological measures pre-lockdown and during lockdown (n = 46) and serum cortisol levels (µg/dl) pre-lockdown and post-lockdown (n = 38).
Figure 2. Correlation between changes in serum cortisol levels (µg/dl) and psychological measures in females (n = 24; darker line with a positive slope) and males (n = 14; lighter line with a negative slope) (a) Correlation between changes in serum cortisol levels (µg/dl) and perceived stress during lockdown; (b) Correlation between changes in serum cortisol levels (µg/dl) and anxiety during lockdown.
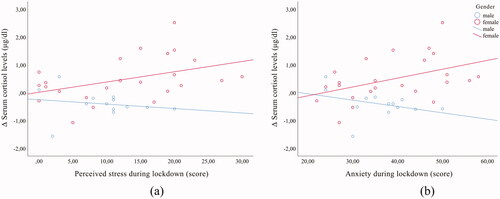
Figure 3. Gut microbiota composition changes at the phylum level; the relative abundance of bacterial phyla pre-lockdown and post-lockdown (n = 38; 24 males, 14 females).
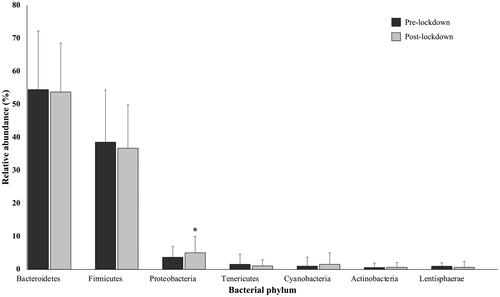
Figure 4. Gut microbiota composition changes at the genus level; the relative abundance of bacterial genera pre-lockdown and post-lockdown (n = 38; 24 males, 14 females).
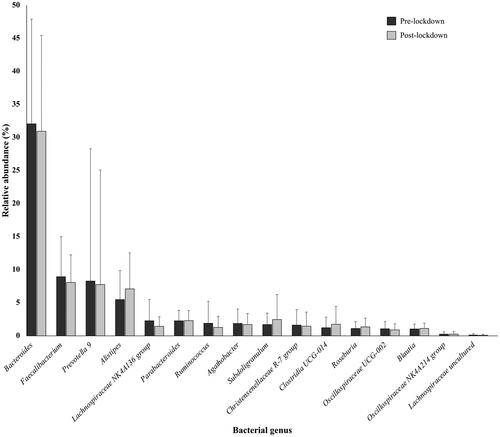
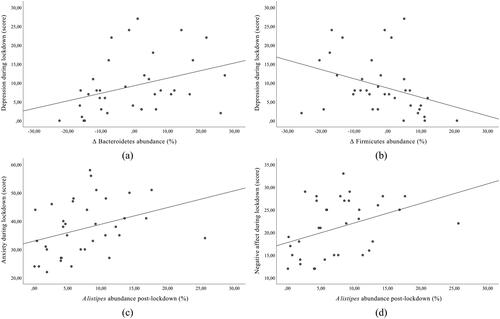
Figure 5. Correlation between gut microbiota composition and psychological measures (n = 38; 24 males, 14 females) (a) Correlation between changes in Bacteroidetes abundance and depression during lockdown; (b) Correlation between changes in Firmicutes abundance and depression during lockdown; (c) Correlation between Alistipes abundance post-lockdown and anxiety during lockdown; (d) Correlation between Alistipes abundance post-lockdown and negative affect during lockdown.
Data availability statement
The data presented in this study are available on request from the corresponding author.