
Figures & data
Table 1. List and details of studies used in the meta-analysis.
Figure 1. Analysis of RNA-seq datasets from studies which have used chronic stress protocols in male mice to examine the impact on the PFC transcriptome. (A) Pearson correlation plot of average gene expression across all the seven studies that were the included in this study. (B) Heatmaps indicating degree of fold-change and the number of differentially expressed genes in each study and in the combined analysis (bottom row) for stress vs control mice. (C) UpSet plot of overlaps between the various datasets that were analyzed. The vertical lines which connect black circles indicate intersecting sets of genes between studies. The y-axis of the histogram indicates the number of intersecting genes and the bar plot on the right-hand side indicates the number of genes in each set. (D–G) EnrichR analysis of differentially expressed genes in the combined analysis for stress vs control mice. (H) Predicted upstream regulators of the differentially expressed genes in the combined analysis as determined using IPA.
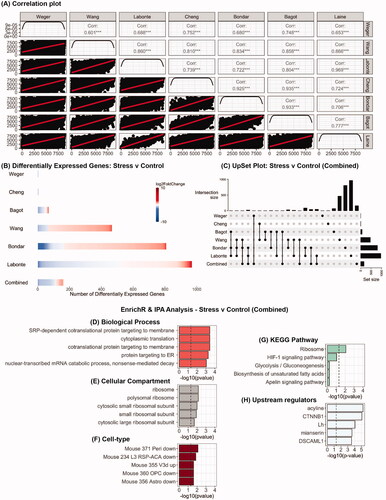
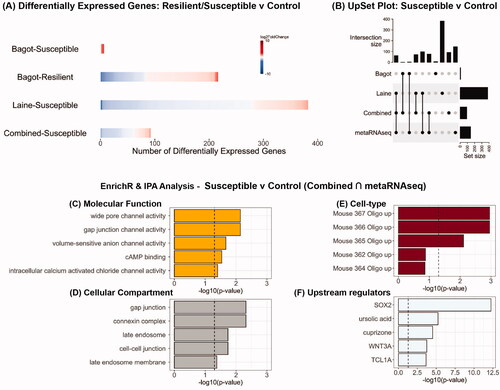
Figure 2. Analysis of RNA-seq datasets from studies which have used chronic social defeat stress to examine the impact on the PFC transcriptome in male mice classified as resilient or susceptible. (A) Heatmaps indicating degree of fold-change and the number of differentially expressed genes in each study and in the combined analysis (bottom row) for susceptible vs control and resilient vs control mice. (B) UpSet plot of overlaps between the various datasets that were analyzed. (C–E) EnrichR analysis for differentially expressed genes that were common in the combined analysis and metaRNAseq analysis for susceptible vs control mice. (F) Predicted upstream regulators of the differentially expressed genes that were common in the combined analysis and metaRNAseq analysis for susceptible vs control mice.
Supplemental Material
Download MS Excel (152.9 KB)Supplemental Material
Download MS Excel (372.8 KB)Data availability statement
All data generated or analyzed during this study are freely available on the NCBI GEO website. Accession details have been included in . Scripts for analysis of data are available on request.