Figures & data
Table 1. Summary statistics for the sample. Immune cell counts are averaged across all 8 time-points in both sessions.
Figure 1. Study design for both sessions (TSST and no-stress condition). Sessions were separated by one week. Time is denoted as minutes measured from the 15-minute long TSST or resting condition (0 = midway point in session).
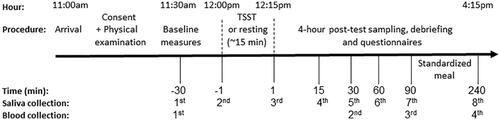
Table 2. Final best fit models for each cell type.
Figure 2. Total white blood cell counts (Est ± SE) across time within the ELA group vs. control group in the TSST and no-stress sessions. Time is denoted as minutes measured from the 15-minute long TSST or resting condition (0 = midway point of session).
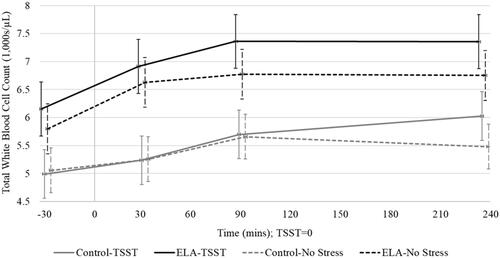
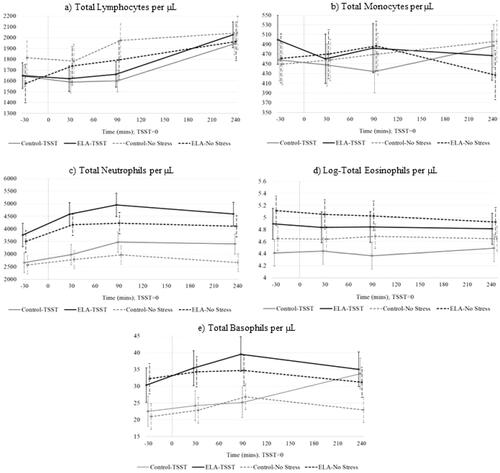
Figure 3. Immune cell counts (Est ± SE) across time for ELA-group vs. control-group within the TSST and no-stress conditions. Time is denoted as minutes measured from the 15-minute long TSST or resting condition (0 = midway point of session).