
Figures & data
Figure 1. Timeline of study procedures. HR: heart rate recording interval; VAS: visual analogue scale subjective stress rating; S: saliva sample; TSST: Trier Social Stress Test; Control: control tasks; CANTAB: spatial working memory subtest of the Cambridge Neuropsychological Test Automated Battery.
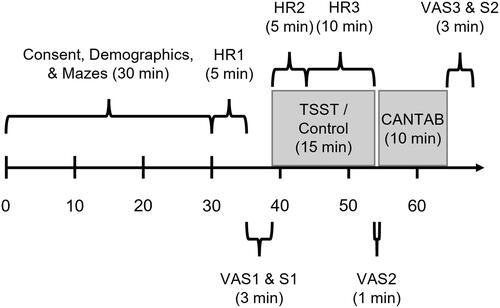
Figure 2. (a) Untransformed mean visual analogue scale (VAS) subjective stress ratings made at baseline (VAS1), immediately following the Trier Social Stress Test or control tasks (VAS2), and immediately following the CANTAB spatial working memory task (VAS3). (b) Untransformed mean salivary cortisol levels at baseline (S1) and immediately following the CANTAB spatial working memory task (S2). All participant data points are also plotted. Control: control group participants; Stress: stress group participants.
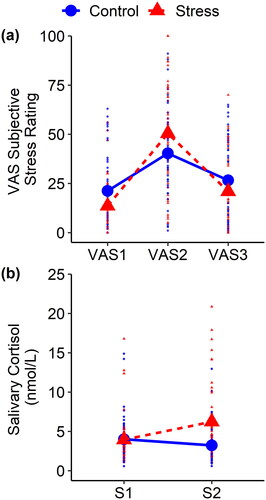
Figure 3. (a) Mean spatial working memory between search errors. (b) Mean first box-based strategy proportions. (c) Mean sequence-based strategy proportions. All participant data points are also plotted. Control: control group participants; Stress: stress group participants.
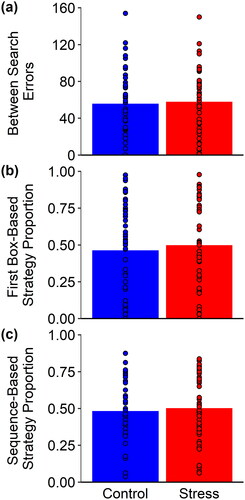
Table 1. Pearson product-moment correlations between stress group participants’ subjective stress responses, cortisol stress responses, between search errors, first box-based strategy proportions, and sequence-based strategy proportions.
Supplemental Material
Download Zip (64.1 KB)Data availability statement
Data are available from the corresponding author upon request.