
Figures & data
Figure 1. Schematic of TSST and measures. The TSST (Kirschbaum et al., Citation1993) consisted of 5 min of anticipation, 5 min speech, and 5 min mental math periods. The current report addresses salivary cortisol taken at baseline, immediately post-TSST, and 10 min post-TSST. The PANAS-now (Watson et al., Citation1988) was administered immediately pre-TSST and immediately post-TSST. The question “How stressed are you now?” was assessed at baseline and immediately post-TSST. No self-report measures were administered at 10 min post-TSST. Mean cortisol levels at each time point are depicted.
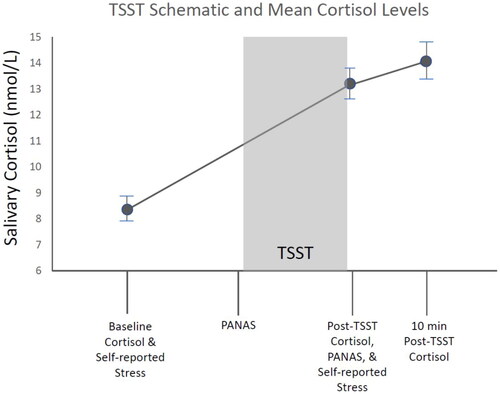
Table 1. Cortisol levels, affect, and self-reported stress with respect to the TSST.
Figure 2. Greater stress-induced cortisol increases are associated with smaller increases in negative affect during stress. Specifically, increase in cortisol (AUCi; original units in nmol/L) is inversely correlated with increase in negative affect assessed using the PANAS immediately after the TSST with respect to baseline, r(67) = −0.24, p < 0.049.
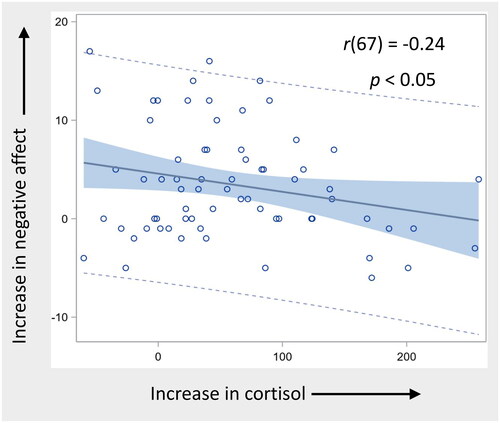
Table 2. Multiple regression predicting increase in negative affect (NA) in response to the TSST.
Supplemental Material
Download MS Word (14.5 KB)Data availability statement
Data are shared and available through the National Institute of Mental Health Data Archive.