
Figures & data
Figure 1. Experimental protocol timeline. Rats were allotted 7 d for recovery from surgery and 8 d for baseline measurements, which included diurnal and restraint stress ACTH and corticosterone. After 10 d of sucrose SA and 10 d of oxycodone SA during a 26-d timespan, rats entered the abstinence phase and were acclimated to the sleep restriction apparatuses. During the next 35 d of abstinence, sleep restriction or ambulation control conditions were carried out. HPA axis assessments were repeated on Days 20–23 of sleep restriction or control conditions. The final nine experimental days of sleep restriction or control conditions were composed of extinction testing, footshock reinstatement, and tissue harvests.
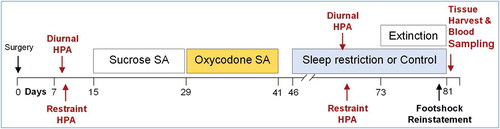
Table 1. mRNA data not shown in (fold-change from Male AC).
Figure 2. Diurnal plasma ACTH (upper panels) and corticosterone (lower panels) in female and male rats Before and then During abstinence from opioids in rats under sleep restricted (SR) conditions vs. ambulatory controls (AC) (Male: N = 15–16 per mean/SE for treatment groups; Female: N = 14–16 per mean/SE for treatment groups). All statistical symbols are p < 0.05. (a) Male different from female within Before or During, (b) During different from Before within sex. For overall ANOVA and all specific comparisons, see the link to Supplementary Table 2 in the reference list (Raff, Citation2022b).
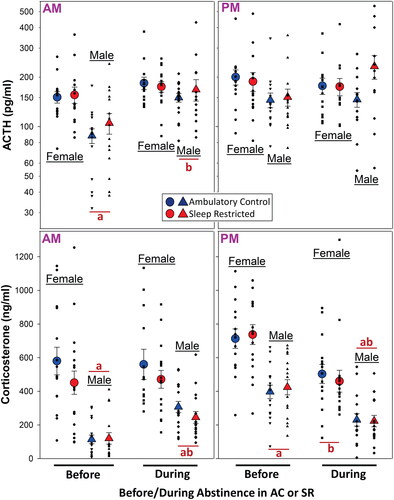
Figure 3. Plasma ACTH and corticosterone response to 30 min of restraint in male and female rats Before and then During abstinence from opioids in ambulatory control rats and rats under sleep restricted conditions (N values as in ; mean/SE). All statistical symbols are p < 0.05. Symbol colors are specific to AC (blue) or SR (red) rats. (a) Different from 0 min; (b) above the dashed line indicates an overall difference between AC and SR “During” by Hotelling’s test (p < 0.019); (c) different from “Before” at that time point. c above the dashed line indicates an overall difference from “Before” by Hotelling’s test for AC (p = 0.0027) and SR (p = 0.026) rats. (d) Different from male within same treatment at same time point. For overall ANOVA and all specific comparisons, see link to Supplementary Table 2 in the reference list (Raff, Citation2022b).
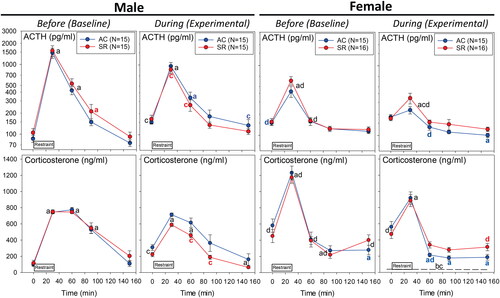
Figure 4. Paraventricular nucleus mRNAs for corticotropin-releasing factor (CRH) and arginine vasopressin (AVP) from brains obtained at the end of the abstinence/sleep restriction vs. abstinence/ambulatory control periods. Data shown as fold changes (calculations described in Methods section). N = 6 per mean/standard error. All statistical symbols are p < 0.05. (a) Different from AC within sex. (b) different from male within treatment group.
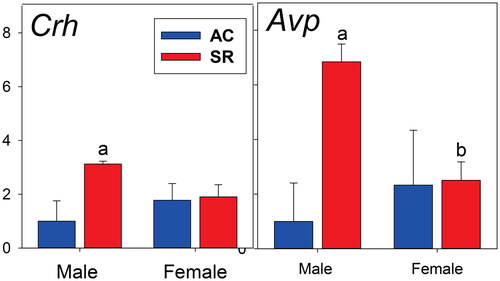
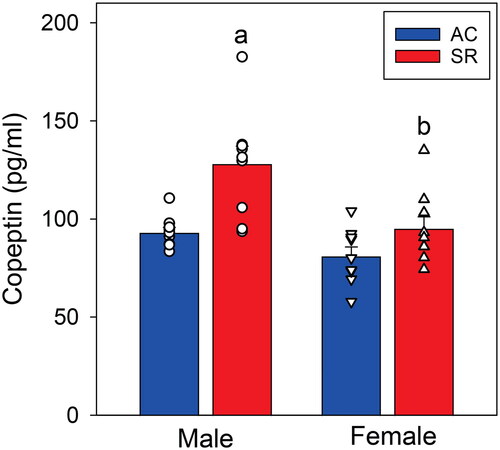
Figure 5. Plasma copeptin concentration at the end of the abstinence/sleep restriction vs. abstinence/ambulatory control periods (N = 9 per mean/SE). (a) Different from AC within sex (p < 0.001). (b) Different from male within treatment group (p < 0.001).
Supplemental Material
Download Zip (206 KB)Data availability statement
All data generated or analyzed during this study are included in this published article or in the supplementary files in the data repository cited in the references.